
Sexual Orientation - Staff Monitoring Report 2024/25
Sexual Orientation 2024/25
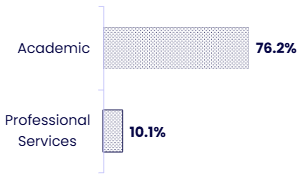
Despite continued progress in disclosure rates, sexual orientation data is only held for just under half of the workforce, which limits the extent to which conclusions can be drawn about the overall population. Disclosure from Academic Staff is high at 76.2%. Disclosure rates of Professional Services and Support Staff were impacted by a system change in 2021 where sexual orientation data was not migrated to the new system.
The University’s LGBQA representation (Lesbian, Gay, Bisexual, Queer, and Asexual) within Academic staff is more than 1 in 20 staff at 5.5%, higher than the HESA benchmark of 5.2%. This shows a strong representation amongst Academic Staff.
The 76.2% disclosure rate among Academic University staff is higher than HESA (total) benchmark of less than two thirds. Disclosure was highest among over 45s.
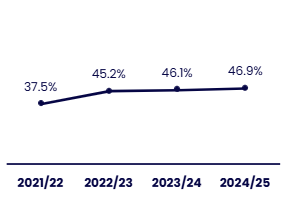
Total disclosure rate over time
| Year | % Disclosure rate |
|---|---|
| 2021/22 | 37.5% |
| 2022/23 | 45.2% |
| 2023/24 | 46.1% |
| 2024/25 | 46.9% |
The disclosure rate increased over the period but remains below 50%.
Disclosure rate by Employee group
| Employee group | % Disclosure rate |
|---|---|
| Academic | 76.2% |
| Professional Services | 10.1% |
The disclosure rate is substantially higher among Academic Staff compared with Professional Services Staff.
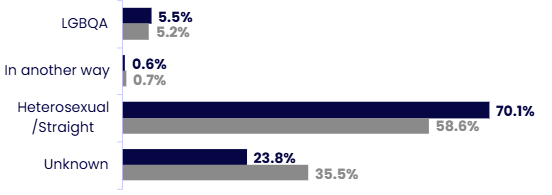
Proportion of Academic Staff by Sexual Orientation vs HESA (Academic and Professional Services and Support Staff)
| Sexual Orientation | % OU | % HESA |
|---|---|---|
| LGBTQA | 5.5% | 5.2% |
| In another way | 0.6% | 0.7% |
| Heterosexual /Straight | 70.1% | 58.6% |
| Unknown | 23.8% | 35.5% |
The OU has a higher proportion of staff who are Heterosexual /Straight compared to HESA and a smaller proportion of unknown sexual orientation.
HESA Sector data taken from Advance HE statistical report 2024 for all staff
Sexual Orientation - Disclosure rate by Employee group and Age
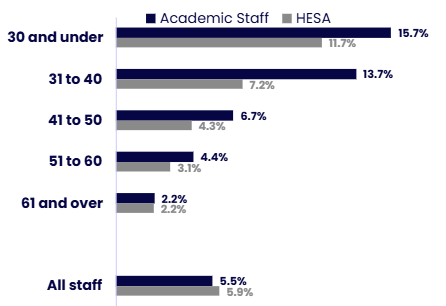
Among staff who have disclosed, LGBQA representation varies by age group and employee group. Disclosure is lowest, but representation is highest among younger staff. In 2024/25, 15.7% of Academic Staff aged 30 and under and 13.7% of those aged 31–40 identified as LGBQA. Representation decreases with increasing age, falling to 6.7% among Academic Staff aged 41–50, 4.4% among those aged 51–60, and 2.2% among those aged 61 and over.
Across Professional and Support Staff, LGBQA representation is lower in all age groups There is no LGBQA representation recorded among Professional and Support Staff aged 61 and over. The data quality of Professional and Support Staff has been impacted by data migration from legacy systems in 2021. Work is ongoing to address this.
Academic Staff LGBTQA representation by Age group vs HESA (all staff)
| Sexual Orientation | % Academic staff | % HESA |
|---|---|---|
| 30 and under | 15.7% | 11.7% |
| 31 to 40 | 13.7% | 7.2% |
| 41 to 50 | 6.7% | 4.3% |
| 51 to 60 | 4.4% | 3.1% |
| 61 and over | 2.2% | 2.2% |
| All staff | 5.5% | 5.9% |
Representation of LGBQA Academic Staff is higher than the HESA benchmark in most age groups.
HESA Sector data taken from Advance HE statistical report 2024 for all staff
Academic Staff LGBTQA representation by Employee Group and Age
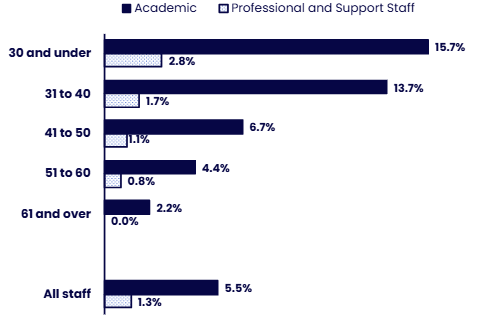
| Sexual Orientation | % Academic | % Professional and Support staff |
|---|---|---|
| 30 and under | 15.7% | 2.8% |
| 31 to 40 | 13.7% | 1.7% |
| 41 to 50 | 6.7% | 1.1% |
| 51 to 60 | 4.4% | 0.8% |
| 61 and over | 2.2% | 0.0% |
| All staff | 5.5% | 1.3% |
Representation is higher among Academic Staff than Professional and Support Staff across all age groups.
Contact us
Equality, Diversity and Inclusion
The Open University
Walton Hall
Milton Keynes
MK7 6AA
Email [email protected]


Explore

Undergraduate
Postgraduate
Policy
-
Follow us on Social media
-


