
Ethnicity - Staff Monitoring Report 2024/25
Ethnicity 2024/25
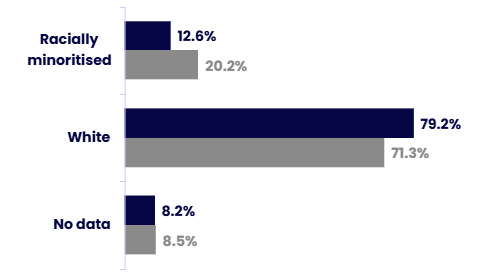
One in eight University staff (12.6%) are from racially minoritised backgrounds, which has continued to rise for a fifth year, to our highest level yet. Though this remains over a third lower than the HESA sector benchmark of 20.2%.
1 in 12 staff chose not to disclose their ethnicity - 8.2%, slightly lower than the 8.5% seen in HESA data. Disclosure rates increased with age in both data sets.
A key driver of Ethnic diversity is the University’s older age profile, particularly in Academic roles. Those with lower average age have higher racially minoritised representation. Associate Lecturers are the largest employee group, with the highest average age, and have the lowest racially minoritised representation.
Despite this, our senior representation (13.1%) has exceeded overall representation, driven largely by professorial representation of Asian, and Other ethnic backgrounds
Proportion of staff by ethnicity group VS HESA
| Ethnicity group | % OU | % HESA |
|---|---|---|
| Racially minoritised | 12.6% | 20.2% |
| White | 79.2% | 71.3% |
| No data | 8.2% | 8.5% |
The OU has lower ethnic diversity than the HESA benchmark, with a smaller proportion of racially minoritised colleagues and a higher proportion of White colleagues.
HESA Sector data taken from 2026 report on 2024/25 statistics
Ethnicity – Population and Disclosure Rate over 5 years
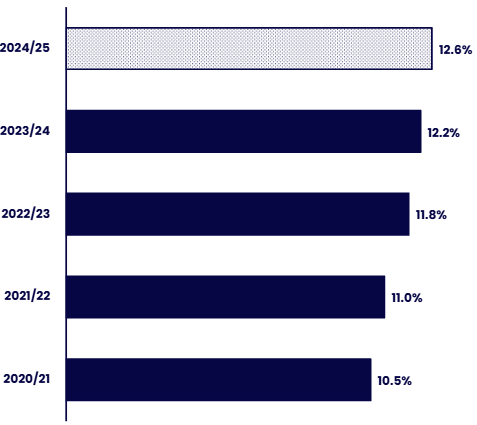
The proportion of staff from racially minoritised backgrounds at the OU has increased steadily over the last five years, rising from 10.5% in 2020/21 to 12.6% in 2024/25, the highest level recorded during this period. Year‑on‑year growth has been gradual but consistent, with increases observed in each reporting year.
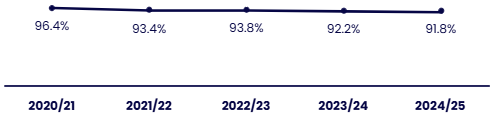
Over the same period, although ethnicity disclosure rates have remained high, they have declined from 96.4% in 2020/21 to 91.8% in 2024/25., with the most recent year on year reduction slowing from 1.6 to 0.4 percentage points. This reflects reductions in disclosure seen in HESA data.
Despite this reduction in disclosure, the continued increase in reported representation suggests that the upward trend in racially minoritised staff is not solely attributable to changes in disclosure behaviour, but reflects a genuine change in workforce composition.
Disclosure Rate: Proportion of staff declaring their ethnicity
| Year | % Disclosure rate |
|---|---|
| 2020/21 | 96.4% |
| 2021/22 | 93.4% |
| 2022/23 | 93.8% |
| 2023/24 | 92.2% |
| 2024/25 | 91.8% |
The disclosure rate remains high throughout the period, exceeding 90% in every year, with a a gradual downward trend.
Representation of racially minoritised staff at the OU across a 5-years period
| Year | % Racially minoritised |
|---|---|
| 2024/25 | 12.6% |
| 2023/24 | 12.2% |
| 2022/23 | 11.8% |
| 2021/22 | 11.1% |
| 2020/21 | 10.5% |
Representation of racially minoritised colleagues has increased steadily over the five-year period.
Ethnicity – Employee Group and Subgroup
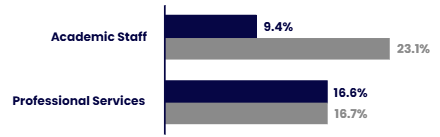
Racially minoritised representation is not evenly distributed between role types. Academic Staff representation is much lower, and furthest below the HESA benchmark (9.4% vs 23% HESA).
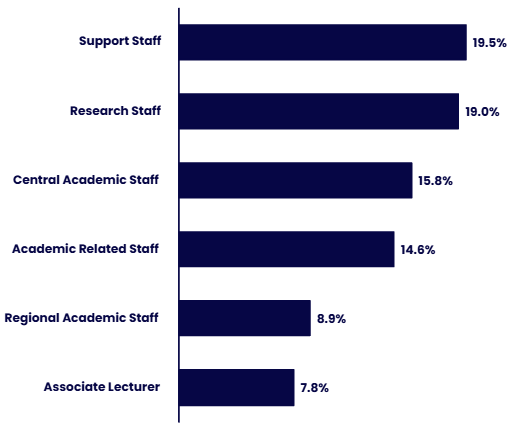
Nearly 1 in 5 staff in Support and Research roles are racially minoritised, compared to fewer than 1 in 10 Regional Academic and Associate Lecturer roles.
Support Staff and Research roles have the youngest average age (~43), and Regional Academic and Associate Lecturer roles have the highest (53 and 56 respectively), which reflects expected diversity levels.
Associate Lecturers make up the largest employee subgroup, and have the lowest racially minoritised representation.
Representation of Racially minoritised staff by Employee Group
| Employee group | % OU | % HESA |
|---|---|---|
| Academic Staff | 9.4% | 23.1% |
| Professional Services | 16.6% | 16.7% |
Racially minoritised colleagues are better represented within Professional Services than Academic Staff, compared with the HESA benchmark.
HESA Sector data taken from 2026 report on 2024/25 statistics
Representation of Racially minoritised staff in each Employee subgroup
| Employee Subgroup | % Racially minoritised staff |
|---|---|
| Support Staff | 19.5% |
| Research Staff | 19.0% |
| Central Academic Staff | 15.8% |
| Academic Related Staff | 14.6% |
| Regional Academic Staff | 8.9% |
| Associate Lecturer | 7.8% |
Representation of racially minoritised colleagues varies considerably across staff subgroups, with higher representation in support and research roles than in academic roles.
Ethnicity – Ethnicity Subgroup and by Sex
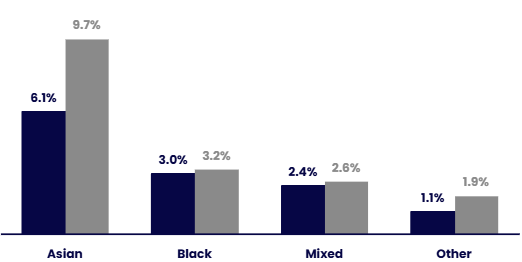
Asian staff have the highest minority representation at 6.1%, but a third below the HESA sector total of 9.7%.
Black staff make up almost a quarter of racially minoritised staff, and 3% of total staff – closely matched against HESA data (3.2%), along with Mixed staff.
The widest percentage gap against HESA relates to representation from Other racially minoritised backgrounds (1.1% vs HESA’s 1.9%).
Representation of minority ethnic subgroups VS HESA
| Ethnicity | % OU | % HESA |
|---|---|---|
| Asian | 6.1% | 9.7% |
| Black | 3.0% | 3.2% |
| Mixed | 2.4% | 2.6% |
| Other | 1.1% | 1.9% |
Representation at the OU is below the HESA benchmark for all minority ethnic subgroups, particularly among Asian colleagues.
HESA Sector data taken from 2026 report on 2024/25 statistics
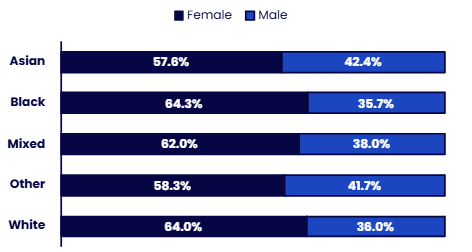
As with our overall workforce, females make up almost two thirds of our racially minoritised staff. The largest sex gaps are among Black, and white staff (over 64% female).
Males have the highest representation among Asian staff, and those from other minoritised backgrounds.
Ethnicity Subgroup by Sex
| Ethnicity | % Female | % Male |
|---|---|---|
| Asian | 57.6% | 42.4% |
| Black | 64.3% | 35.7% |
| Mixed | 62.0% | 38.0% |
| Other | 58.3% | 41.7% |
| White | 64.0% | 36.0% |
All ethnicity subgroups have a higher proportion of women than men, although the gender balance varies slightly between groups.
Ethnicity - representation at senior level
As at 31st July 2025, Black, Asian and minority ethnic staff represented 13.1% (40 out of 306) of the senior staff population, a 0.9 percentage point increase from 2023/24, and now above overall representation (12.6%).
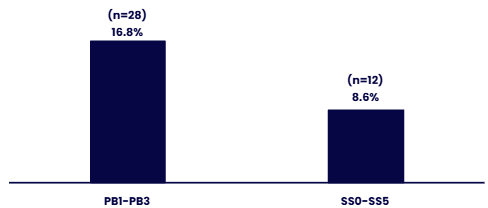
The racially minoritised population is underrepresented within the SS bands (8.6%, 12 out of 139) and account for 16.8% of professor grades. Black colleagues are least represented at senior level, accounting for less than 1.5% of the senior leadership population.
Representation of racially minoritised staff at senior level by grade group- 2022/23
| Grade group | % Racially minoritised staff |
|---|---|
| PB1-PB3 | 16.8% (n=28) |
| SS0-SS5 | 8.6% (n=12) |
Representation of racially minoritised colleagues is higher in the PB1–PB3 grade group than in the SS0–SS5 grade group.3
Proportion of racially minoritised staff at senior level over 5 years
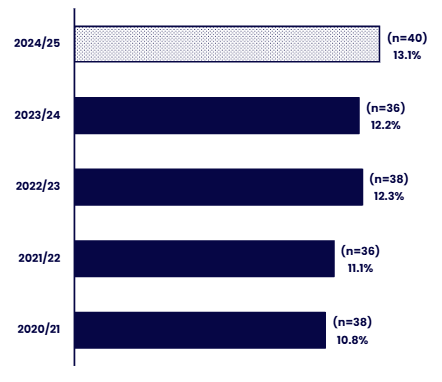
| Year | % Racially minoritised staff |
|---|---|
| 2024/25 | 13.1% (n=40) |
| 2023/24 | 12.2% (n=36) |
| 2022/23 | 12.3% (n=38) |
| 2021/22 | 11.1% (n=36) |
| 2020/21 | 10.8% (n=38) |
The proportion of racially minoritised staff at senior level increased by 2.3 percentage points over the five-year period.
Asian staff have the highest senior representation at 6.9%, above our 6% target, and making up over half of our racially minoritised senior staff.
The widest gap from target is Black senior representation at 1.3% vs 2.7% target. This is also the widest negative gap from overall representation (3%).
Representation of racially minoritised staff subgroups at Senior Level VS Equality Scheme 2026 targets
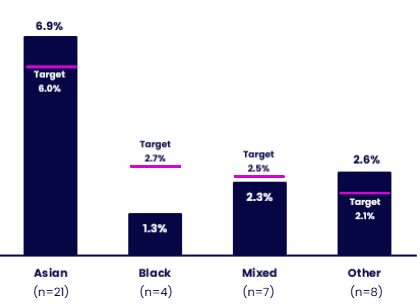
| Ethnicity | % Racially minoritised staff | % Target |
|---|---|---|
| Asian (n=21) | 6.9% | 6.0% |
| Black (n=4) | 1.3% | 2.7% |
| Mixed (n=7) | 2.3% | 2.5% |
| Other (n=8) | 2.6% | 2.1% |
The targets have been met or exceeded for Asian and Other ethnic group colleagues, while representation remains below target for Black and Mixed ethnicity colleagues.
Asian representation in professorial roles is the main driver of total RM senior representation, and more than double Asian representation in Senior Professional Services roles. Other racially minoritised groups also have higher representation in professorial roles, except among Black staff (1.2% of Professors vs 1.4% of senior Professional Services roles).
Breakdown of Senior Staff Representation
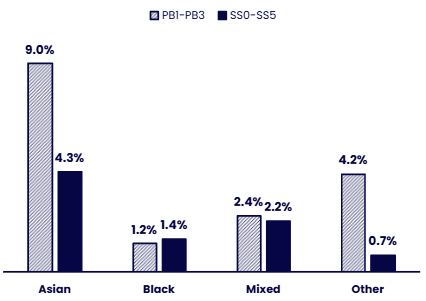
| Ethnicity | PB1-PB3 | SS0-SS5 |
|---|---|---|
| Asian | 9.0% | 4.3% |
| Black | 1.2% | 1.4% |
| Mixed | 2.4% | 2.2% |
| Other | 4.2% | 0.7% |
Representation of racially minoritised ethnic subgroups is generally higher in PB1–PB3 grades than in SS0–SS5 grades.
Ethnicity - representation by Age group
Representation of staff from racially minoritised backgrounds is highest among younger staff and reduces into older age groups, as shown in HESA benchmark data, as well as in wider comparisons (such as ONS Census and Labour Market data).
The University’s under-representation of younger staff could be a key driver of reduced racially minoritised representation overall. Although representation levels are just over a tenth lower in almost all age groups compared to HESA (except 25 and under, and 56-65). This shows that there is still work to do to increase diversity in our older age groups, which make up the majority of University staff.
The proportion of staff who did not answer or selected 'prefer not to say' was highest among younger staff, reducing with age, consistent with HESA data.
Associate Lecturers make up the largest employee subgroup, have the highest average age (56), and the lowest racially minoritised representation (7.8% or 1 in 13) - acting as a significant driver of the university’s reduced ethnic diversity compared to HESA sector data (12.6% RM vs 20.2% in HESA data).
% Racially minoritised staff by age VS HESA
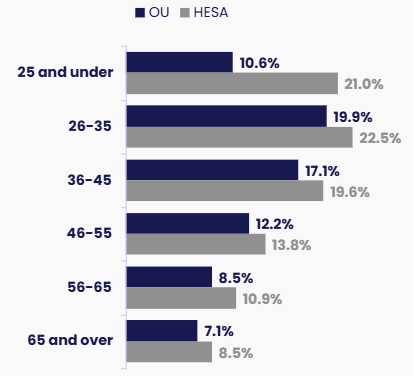
| Age Group | % OU | % HESA |
|---|---|---|
| 25 and under | 10.6% | 21.0% |
| 26 to 35 | 19.9% | 22.5% |
| 36 to 45 | 17.1% | 19.6% |
| 46 to 55 | 12.2% | 13.8% |
| 56 to 65 | 8.5% | 10.9% |
| 66 and over | 7.1% | 8.5% |
Representation of racially minoritised colleagues remains consistently lower at the OU across all age groups.
HESA Sector data taken from Advance HR statistical report 2024
Ethnicity Group - Recruitment
In 2024/25, over 40% of applicants were from racially minoritised communities, but representation decreases through the recruitment pipeline - reducing to just over a quarter of shortlisted applicants, and a fifth of successful applicants. In contrast, representation of white applicants grows through the pipeline.
20% of appointed applicants were from racially minoritised backgrounds, exceeding our current workforce representation of 12.6%, indicating that we should expect workforce representation to continue growing.
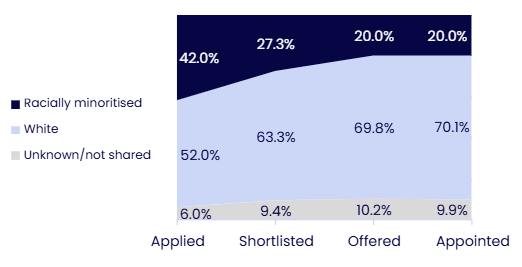
Ethnicity Group | Applicants | Shortlisted | Offered | Appointed | Proportion (of) Applicants shortlisted | Proportion (of) Applicants offered | Proportion (%) of shortlisted appointed after Interview | ||||
|---|---|---|---|---|---|---|---|---|---|---|---|
Number | % | Number | % | Number | % | Number | % | ||||
Racially Minoritised | 5,118 | 42.0% | 548 | 27.3% | 126 | 20.0% | 117 | 20.0% | 10.7% | 2.5% | 21.4% |
White | 6,342 | 52.0% | 1,269 | 63.3% | 440 | 69.8% | 411 | 70.1% | 20.0% | 6.9% | 32.4% |
Unknown/not shared | 733 | 6.0% | 188 | 9.4% | 64 | 10.2% | 58 | 9.9% | 25.6% | 8.7% | 30.9% |
Grand Total | 12,193 | 100.0% | 2,005 | 100.0% | 630 | 100.0% | 586 | 100.0% | 16.4% | 5.2% | 29.2% |
Ethnicity Subgroup - Recruitment
Representation of all racially minoritised groups reduces through the recruitment process, compared to white candidates.
The biggest reduction from application to appointment stage is among Asian candidates – down by two thirds in proportion (25% to 9%) – one third at shortlist stage, and another at offer stage. Representation of Black candidates reduces by a third (10% to 6.5%) at shortlist stage.
Candidates from mixed ethnicity backgrounds have the most consistent representation through the process, and the highest proportion appointed after shortlisting.
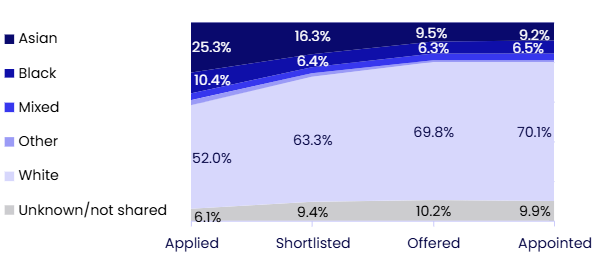
Ethnicity Subgroup | Applied | Shortlisted | Offered | Appointed | Proportion (of) Applicants shortlisted | Proportion (of) Applicants offered | Proportion (%) of shortlisted appointed after Interview | ||||
|---|---|---|---|---|---|---|---|---|---|---|---|
Number | % | Number | % | Number | % | Number | % | ||||
Asian | 3090 | 25.3% | 326 | 16.3% | 60 | 9.5% | 54 | 9.2% | 10.6% | 1.9% | 16.6% |
Black | 1265 | 10.4% | 128 | 6.4% | 40 | 6.3% | 38 | 6.5% | 10.1% | 3.2% | 29.7% |
Mixed | 446 | 3.7% | 61 | 3.0% | 22 | 3.5% | 21 | 3.6% | 13.7% | 4.9% | 34.4% |
Other | 304 | 2.5% | 33 | 1.6% | 4 | 0.7% | 4 | 0.7% | 10.9% | 1.3% | 12.1% |
White | 6342 | 52.0% | 1269 | 63.3% | 440 | 69.8% | 411 | 70.1% | 20.0% | 6.5% | 32.4% |
Unknown/not shared | 746 | 6.1% | 188 | 9.4% | 64 | 10.2% | 58 | 9.9% | 25.2% | 7.8% | 30.9% |
Grand Total | 12193 | 100.0% | 2005 | 100.0% | 630 | 100.0% | 586 | 100.0% | 16.4% | 5.2% | 29.2% |
Contact us
Equality, Diversity and Inclusion
The Open University
Walton Hall
Milton Keynes
MK7 6AA
Email [email protected]


Explore

Undergraduate
Postgraduate
Policy
-
Follow us on Social media
-


