
Sex - Staff Monitoring Report 2024/25
Sex 2024/25
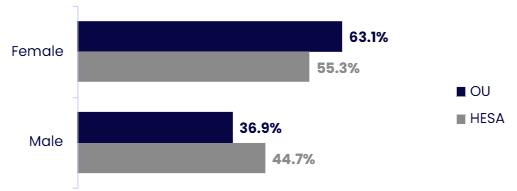
Females continue to make up the majority of the university’s workforce, at 63.1% - significantly higher than the HESA Sector benchmark of 55%.
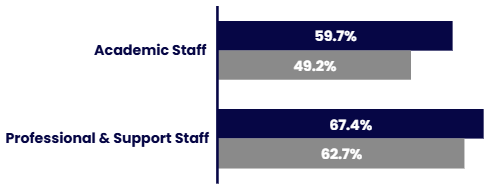
Female staff are particularly highly represented in Professional and Support roles (67.4%), compared to Academic roles (59.7%) – and as with age, Academic staff are the furthest from the HESA Benchmark.
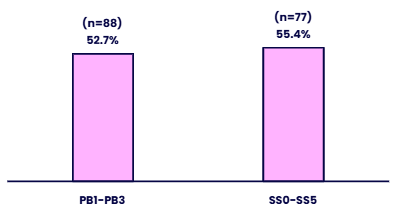
Senior female representation continues to increase, with females making up over half (53.9%) of the senior level population for the last 2 years – with more even representation in Professional services and Academic roles (55.4% and 52.7%) than in the total population.
Senior Academic female representation has increased over the last 5 years, reducing the gap between senior and non-senior representation.
Proportion of the population by Sex vs HESA
| Sex | % OU | % HESA |
|---|---|---|
| Female | 63.1% | 55.3% |
| Male | 36.9% | 44.7% |
The OU has a higher proportion of female staff compared to the HESA benchmark.
HESA Sector data taken from 2026 report on 2024/25 statistics
Proportion of the population by Sex - 5 year trend
| Year | % Female | % Male |
|---|---|---|
| 2020/21 | 62.1% | 37.9% |
| 2021/22 | 62.7% | 37.3% |
| 2022/23 | 63.0% | 37.0% |
| 2023/24 | 63.2% | 36.8% |
| 2024/25 | 63.1% | 36.9% |
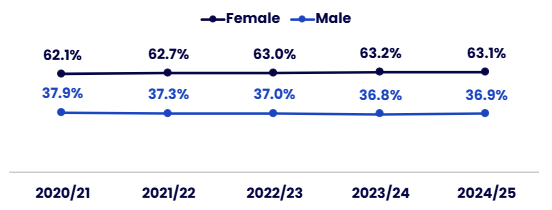
The proportion of female staff remained stable at around 63% (and male at 37%).
Sex by Employee Group and Subgroup
Although females make up 63% all university staff, representation is not evenly distributed between employee groups and role types.
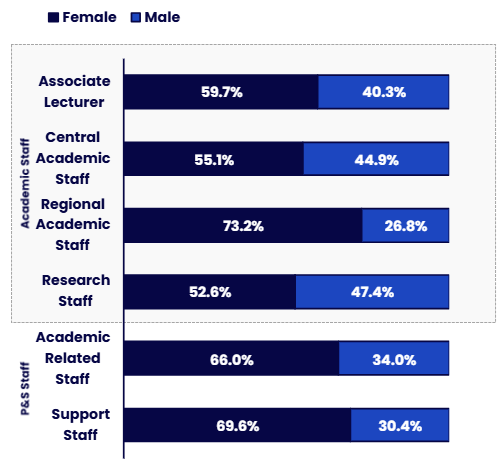
Female staff are particularly highly represented in Professional and Support roles (67.4%), compared to Academic roles (59.7%), with the exception of Regional Academic Staff (73% female).
As with age and ethnicity, Academic Staff are the furthest from HESA benchmark of 49% at nearly 60%.
% Female by employee group vs HESA
| Employee group | % OU | % HESA |
|---|---|---|
| Academic Staff | 59.7% | 49.2% |
| Professional & Support Staff | 67.4% | 62.7% |
The OU has a higher proportion of female Academic Staff and Professional and Support Staff compared to the HESA benchmark.
HESA Sector data taken from 2026 report on 2024/25 statistics
Employee Subgroup by Sex
| Employee Subgroup | % Female | % Male |
|---|---|---|
| Associate Lecturer | 59.7% | 40.3% |
| Central Academic Staff | 55.1% | 44.9% |
| Regional Academic Staff | 73.2% | 26.8% |
| Research Staff | 52.6% | 47.4% |
| Academic Related Staff | 66.0% | 34.0% |
| Support Staff | 69.6% | 30.4% |
Women represent the majority in all staff subgroups.
Sex - representation at senior level
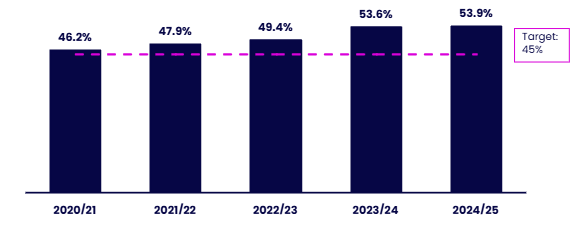
Senior female representation has exceeded the 45% target for the last 5 years, and continues to increase, with females making up over half (53.9%) of the senior level population for the last 2 years.
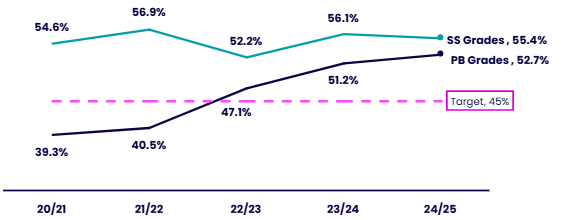
Although Senior female representation remains higher in SS grades (55.4% vs 52.7% in PB grades), our sustained 5-year overall increase is driven by PB grades – increasing by over a third from 39.3% to 52.7%, narrowing the gap from 59.7% total female Academic representation. SS grades now have a wider gap at 52.7% senior %female against 67.4% total female PSS representation.
Representation of females at senior level by grade group
| Grade group | % Female |
|---|---|
| PB1-PB3 | 52.7% (n=88) |
| SS0-SS5 | 55.4% (n=77) |
Female staff represent more than half of senior level staff.
Representation of females at senior level 5yr trend vs 2026 target
| Year | % Female |
|---|---|
| 2020/21 | 46.2% |
| 2021/22 | 47.9% |
| 2022/23 | 49.4% |
| 2023/24 | 53.6% |
| 2024/25 | 53.9% |
Representation exceeded the 45% target in every year and has shown a generally upward trend over the period.
Representation of females at senior level 5yr trend vs 2026 target
| Year | SS Grades | PB Grades |
|---|---|---|
| 20/21 | 54.6% | 39.3% |
| 21/22 | 56.9% | 40.5% |
| 22/23 | 52.2% | 47.1% |
| 23/24 | 56.1% | 51.2% |
| 24/25 | 55.4% | 52.7% |
Female representation in SS grades remained above the target throughout the period, while representation in PB grades increased over time, exceeding the target from 22/23 onwards.
Sex - Recruitment
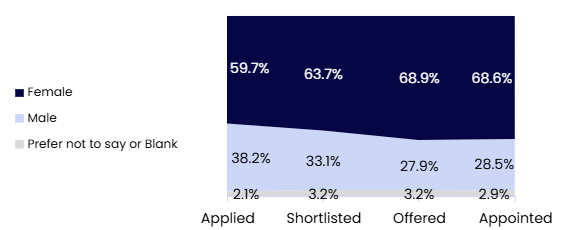
6 out of every 10 applications are from female candidates, which then grows throughout the recruitment pipeline, to almost 7 of every 10 successful applicants.
Male representation starts low at just 38.2% of applicants, reducing by around 5 percentage points at shortlisting and a further 5 percentage points at offer stage – with fewer than 1 in 3 candidates being appointed.
Sex | Applied | Shortlisted | Offered | Accepted | Proportion (of) Applicants shortlisted | Proportion (of) Applicants offered | Proportion (%) of shortlisted appointed after Interview | ||||
|---|---|---|---|---|---|---|---|---|---|---|---|
Number | % | Number | % | Number | % | Number | % | ||||
Female | 7277 | 59.7% | 1277 | 63.7% | 434 | 68.9% | 402 | 68.6% | 17.5% | 6.0% | 31.5% |
Male | 4660 | 38.2% | 663 | 33.1% | 176 | 27.9% | 167 | 28.5% | 14.2% | 3.8% | 25.2% |
Prefer not to say or Blank | 256 | 2.1% | 65 | 3.2% | 20 | 3.2% | 17 | 2.9% | 25.3% | 7.8% | 26.2% |
Grand Total | 12,193 | 100.0% | 2,005 | 100.0% | 630 | 100.0% | 586 | 100.0% | 16.4% | 5.2% | 29.2% |
Contact us
Equality, Diversity and Inclusion
The Open University
Walton Hall
Milton Keynes
MK7 6AA
Email [email protected]


Explore

Undergraduate
Postgraduate
Policy
-
Follow us on Social media
-


