
Age - Staff Monitoring Report 2024/25
Age 2024/25
The age profile of University staff is older than the HESA sector benchmark – driven primarily by the older age profile of Academic Staff, compared to Professional and Support Staff.
The Professional and Support Staff cohort shows a similar age profile to the HESA benchmark distribution, whereas academic staff are more heavily weighted towards the 46 and over age groups compared with the sector average.
University staff are under-represented in age groups in which HESA data show the greatest diversity of ethnicity, disability and sexual orientation. Employee groups with lower average ages reflect these greater diversity profiles but represent a relatively small proportion of total staff. Our largest employee group (Associate Lecturers) is also our oldest, and this is reflected in its reduced diversity profile, and its impact on our overall workforce diversity.
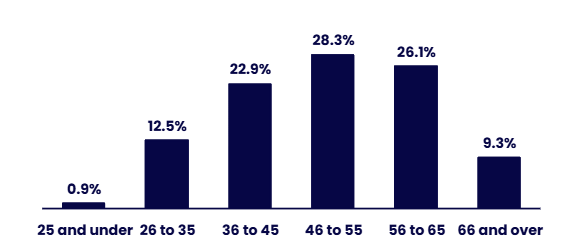
Population by Age Group
| Age Group | % |
|---|---|
| 25 and under | 0.9% |
| 26 to 35 | 12.5% |
| 36 to 45 | 22.9% |
| 46 to 55 | 28.3% |
| 56 to 65 | 26.1% |
| 66 and over | 9.3% |
The age profile is skewed towards older staff, with more than half between 46 to 65 years old.
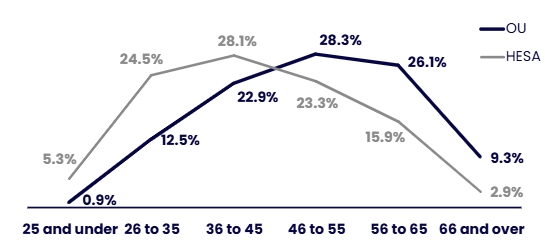
Population by Age Group VS HESA
| Age Group | % OU | % HESA |
|---|---|---|
| 25 and under | 0.9% | 5.3% |
| 26 to 35 | 12.5% | 24.5% |
| 36 to 45 | 22.9% | 28.1% |
| 46 to 55 | 28.3% | 23.3% |
| 56 to 65 | 26.1% | 15.9% |
| 66 and over | 9.3% | 2.9% |
The OU shows an older age profile than the HESA benchmark.
HESA Sector data taken from 2026 report on 2024/25 statistics
Age Group by Employee Group
Academic Staff have an older age profile than Professional and Support Staff. The Professional and Support Staff cohort shows a similar age distribution to the HESA benchmark, whereas Academic Staff are more heavily weighted towards the 46 and over age groups compared with the sector average.
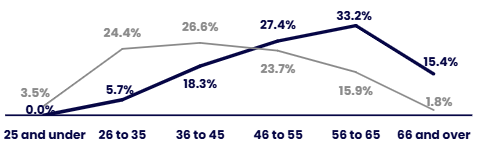
Academic Staff Age Group VS HESA
| Age Group | % OU | % HESA |
|---|---|---|
| 25 and under | 0.0% | 3.5% |
| 26 to 35 | 5.7% | 24.4% |
| 36 to 45 | 18.3% | 26.6% |
| 46 to 55 | 27.4% | 23.7% |
| 56 to 65 | 33.2% | 15.9% |
| 66 and over | 15.4% | 1.8% |
The OU has a markedly older age profile of Academic Staff than the HESA benchmark.
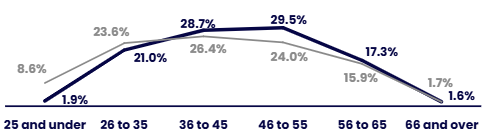
Professional & Support Staff Age Group VS HESA
| Age Group | % OU | % HESA |
|---|---|---|
| 25 and under | 1.9% | 8.6% |
| 26 to 35 | 21.0% | 23.6% |
| 36 to 45 | 28.7% | 26.4% |
| 46 to 55 | 29.5% | 24.0% |
| 56 to 65 | 17.3% | 15.9% |
| 66 and over | 1.6% | 1.7% |
The OU has a slightly older age profile of Professional and Support Staff than the HESA benchmark.
HESA Sector data taken from 2026 report on 2024/25 statistics
Age Group by Employee Group
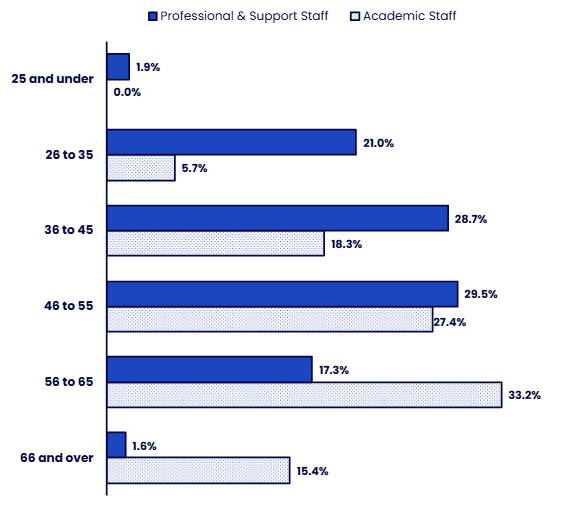
| Age Group | Professional & Support Staff | Academic Staff |
|---|---|---|
| 25 and under | 1.9% | 0.0% |
| 26 to 35 | 21.0% | 5.7% |
| 36 to 45 | 28.7% | 18.3% |
| 46 to 55 | 29.5% | 27.4% |
| 56 to 65 | 17.3% | 33.2% |
| 66 and over | 1.6% | 15.4% |
Academic Staff have an older age profile than Professional and Support Staff.
Average Age by Employee Subgroup
Among Academic Staff, Associate Lecturers have the highest average age, at 55.9 years, which is more than five years above the average age of the workforce overall.
Support Staff and Research Staff have considerably lower average ages, at 43.4 and 43.5 years respectively.
Regional Academic Staff have a slightly lower average age than Associate Lecturers, at 53.1 years.
Given that many Regional Academic Staff also hold Associate Lecturer contracts, this pattern may reflect differences in age profiles between Associate Lecturers with multiple roles and those holding a single post.
Average Age (in years) by Employee Subgroup
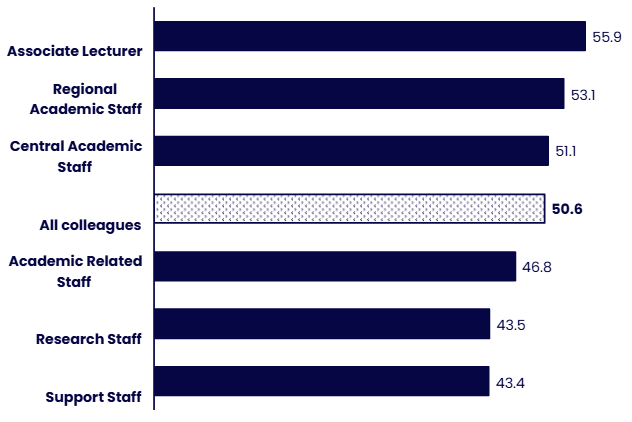
| Employee Subgroup | Average Age |
|---|---|
| Associate Lecturer | 55.9 |
| Regional Academic Staff | 53.1 |
| Central Academic Staff | 51.1 |
| All colleagues | 50.6 |
| Academic Related Staff | 46.8 |
| Research Staff | 43.5 |
| Support Staff | 43.4 |
Academic staff groups tend to have a higher average age than research and support staff.
Age - Recruitment
Candidates aged 35 to 64 make up a higher proportion of appointments than of applicants, while younger candidates are less represented at appointment stage.
This pattern is most pronounced among those aged 24 and under, who account for 9.4% of applicants but only 4.3% of appointments.
In contrast, candidates aged 45–54 represent 16.3% of applicants but 24.3% of appointments, and those aged 55–64 account for 5.6% of applicants and 10.8% of appointments.
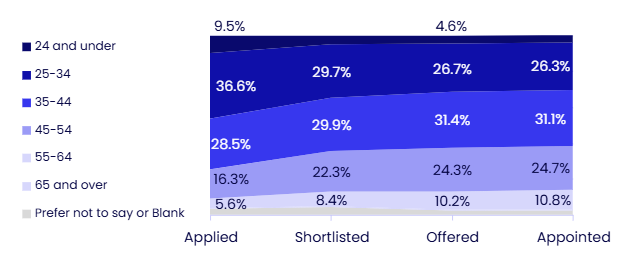
Age Group | Applied | Shortlisted | Offered | Appointed | Proportion (of) Applicants shortlisted | Proportion (of) Applicants offered | Proportion (%) of shortlisted appointed after Interview | ||||
|---|---|---|---|---|---|---|---|---|---|---|---|
Number | % | Number | % | Number | % | Number | % | ||||
24 and under | 1148 | 9.4% | 101 | 5.1% | 29 | 4.6% | 25 | 4.3% | 8.8% | 2.5% | 24.8% |
25-34 | 4464 | 36.6% | 596 | 29.7% | 168 | 26.7% | 154 | 26.3% | 13.4% | 3.8% | 25.8% |
35-44 | 3480 | 28.5% | 600 | 29.9% | 198 | 31.4% | 182 | 31.1% | 17.2% | 5.7% | 30.3% |
45-54 | 1993 | 16.3% | 447 | 22.3% | 153 | 24.3% | 145 | 24.7% | 22.4% | 7.7% | 32.4% |
55-64 | 680 | 5.6% | 168 | 8.4% | 64 | 10.2% | 63 | 10.8% | 24.7% | 9.3% | 37.5% |
65 and over | 42 | 0.3% | 11 | 0.5% | 3 | 0.5% | 3 | 0.5% | 26.2% | 7.1% | 27.3% |
Prefer not to say or Blank | 386 | 3.2% | 82 | 4.1% | 15 | 2.3% | 14 | 2.3% | 21.2% | 3.6% | 17.1% |
Grand Total | 12,193 | 100.0% | 2,005 | 100.0% | 630 | 100.0% | 586 | 100.0% | 16.4% | 5.2% | 29.2% |
Contact us
Equality, Diversity and Inclusion
The Open University
Walton Hall
Milton Keynes
MK7 6AA
Email [email protected]


Explore

Undergraduate
Postgraduate
Policy
-
Follow us on Social media
-


