
Disability - Staff Monitoring Report 2024/25
Disability 2024/25
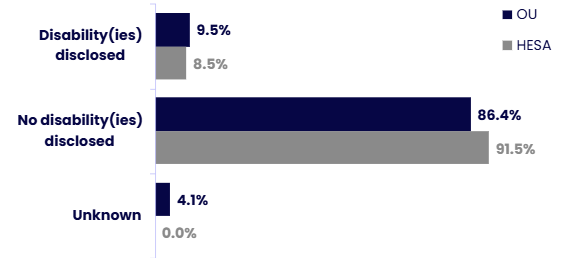
Almost 1 in 10 university staff have disclosed disability(ies), higher than the 8.5% HESA sector benchmark. Although just over 4% chose not to provide data, highest among staff aged 25-44, and lowest among over 45s.
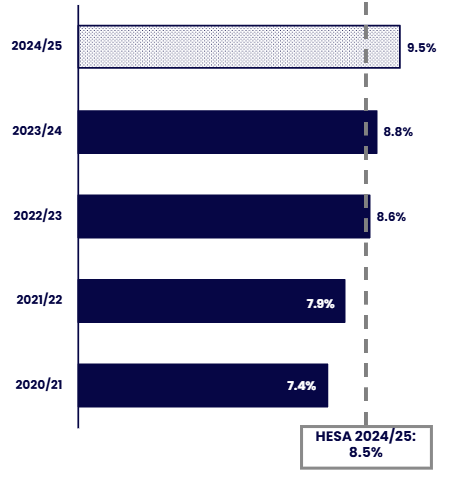
After steadily increasing from 7.4% in 2020/21, this is the highest proportion the University has reported.
There is even representation broadly between Academic (9.6%) and Professional Services (9.4%) roles, but wider differences between individual role types, ranging between 1 in 9 Regional Academics and 1 in 14 Academic Related staff.
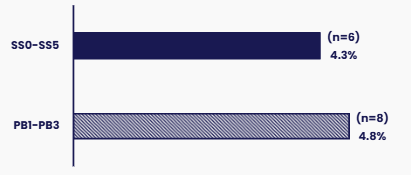
Despite a recent increase, senior representation remains comparably low (4.6%) - less than half of the overall representation level, with the lowest representation among Professional Services staff (4.3% vs 4.8% of Professor roles).
Proportion of staff by Disability Declaration vs HESA
| Disability declaration | % OU | % HESA |
|---|---|---|
| Disability(ies) disclosed | 9.5% | 8.5% |
| No disability(ies) disclosed | 86.4% | 91.5% |
| Unknown | 4.1% | 0.0% |
The OU has a slightly higher proportion of colleagues disclosing a disability than the HESA benchmark.
HESA Sector data taken from 2024/25 data, published in 2026
Disability – Population and Disclosure Rate over 5 years
The proportion of staff declaring a disability has increased steadily over the last five years, rising from 7.4% in 2020/21 to 9.5% in 2024/25, the highest level observed during this period. The most notable increases occurred between 2021/22 and 2022/23, with more gradual year‑on‑year growth thereafter.
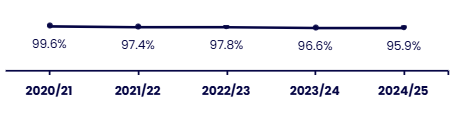
Disclosure rates have fallen year on year from 99% to 96%, indicating that the increase in reported disability is unlikely to be driven by changes in disclosure behaviour alone. Instead, this trend suggests a genuine increase in the number of staff identifying as disabled, alongside sustained engagement with equality monitoring.
Disclosure Rate: Proportion of staff declaring 'Yes' or 'No' to Disability Question
| Year | % Disclosure rate |
|---|---|
| 2020/21 | 99.6% |
| 2021/22 | 97.4% |
| 2022/23 | 97.8% |
| 2023/24 | 96.6% |
| 2024/25 | 95.9% |
The disability disclosure rate remains consistently high throughout the period.
Proportion of staff with disability over 5 years
| Year | % with disability |
|---|---|
| 2024/25 | 9.5% |
| 2023/24 | 8.8% |
| 2022/23 | 8.6% |
| 2021/22 | 7.9% |
| 2020/21 | 7.4% |
The proportion of staff disclosing a disability increased by 2.1 percentage points over the five-year period and is now above the HESA benchmark of 8.5%.
Disability by Employee Group and Subgroup
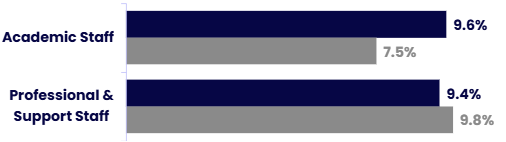
In 2024/25, the proportion of staff disclosing a disability(ies) is similar across Academic and Professional & Support staff, at 9.6% and 9.4% respectively. Academic staff are above, with the widest gap from the HESA Benchmark. However, Academic Staff have a notably higher proportion of ‘Unknown’ disability status (6.7%) compared with Professional & Support Staff (0.8%).
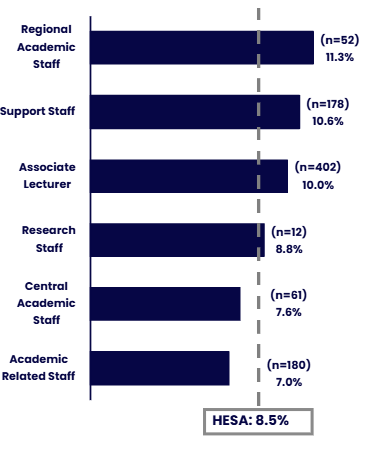
By employee subgroup, Regional Academic Staff have the highest proportion of staff declaring a disability (11.3%), followed by Support Staff (10.6%) and Associate Lecturers (10.0%). Research Staff report a lower proportion (8.8%), with the lowest levels observed among Central Academic Staff (7.6%) and Academic‑related Staff (7.0%).
Overall, while disability declaration rates are broadly comparable between Academic and Professional & Support staff, variation across subgroups is evident, and differences in disclosure—particularly within academic roles—remain an important consideration when interpreting
these figures.
Disabled representation by group vs HESA
| Employee group | % OU | % HESA |
|---|---|---|
| Academic Staff | 9.6% | 7.5% |
| Professional & Support Staff | 9.4% | 9.8% |
Disability representation among Academic Staff is higher than the HESA benchmark while it is slightly lower for Professional and Support Staff.
HESA Sector data taken from 2026 report on 2024/25 statistics
Proportion of staff with disability(ies) by employee subgroup
| Employee Subgroup | % staff with disability(ies) |
|---|---|
| Regional Academic Staff | 11.3% (n=52) |
| Support Staff | 10.6% (n=178) |
| Associate Lecturer | 10.0% (n=402) |
| Research Staff | 8.8% (n=12) |
| Central Academic Staff | 7.6% (n=61) |
| Academic Related Staff | 7.0% (n=180) |
Four staff subgroups exceed the HESA benchmark of 8.5%, while Central Academic Staff and Academic Related Staff have lower levels of disability representation.
Disability - representation at senior level
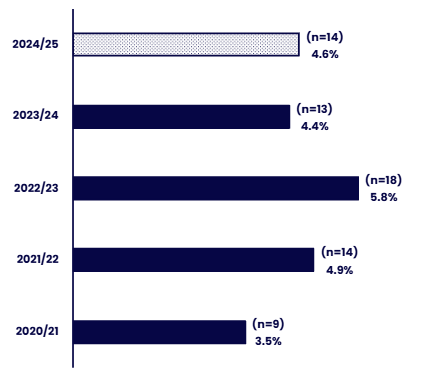
The proportion of staff declaring a disability at senior level has increased over the last five years, rising from 3.5% in 2020/21 to 4.6% in 2024/25. Although there was a higher point in 2022/23 (5.8%), representation declined in 2023/24 before increasing again in the most recent year.
In 2024/25, disabled staff representation is slightly higher within professorial grades (PB1–PB3) at 4.8% than within Senior Staff grades (SS0–SS5) at 4.3%. While numbers remain small across both grade groups, this suggests that recent increases at senior level have been driven more by representation within professor grades than within senior staff roles.
Representation of disabled staff at senior level by grade group
| Grade group | % Disabled staff |
|---|---|
| SS0-SS5 | 4.3% (n=6) |
| PB1-PB3 | 4.8% (n=8) |
Disability representation is slightly higher among staff in PB1–PB3 grades, compared with staff in the SS0–SS5 grades.
Proportion (%) of staff with a disability at senior level across 5 years
| Year | % with disability |
|---|---|
| 2024/25 | 4.6% (n=14) |
| 2023/24 | 4.4% (n=13) |
| 2022/23 | 5.8% (n=18) |
| 2021/22 | 4.9% (n=14) |
| 2020/21 | 3.5% (n=9) |
The proportion of senior staff disclosing a disability slightly increased over time until 2022/23 before declining slightly.
Disability - representation by Age group
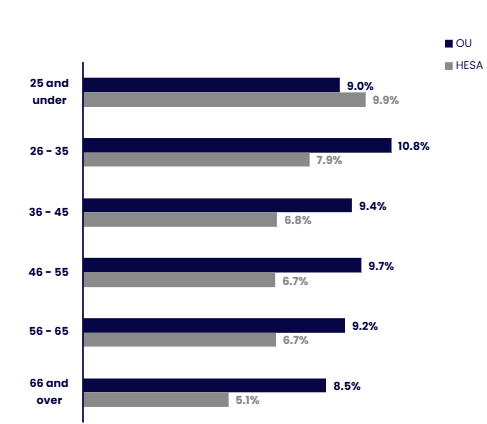
The proportion of staff disclosing disability(ies) is reasonably consistent across all age groups, with the highest representation is in the 26-35 age group, which then reduces into older age groups.
HESA comparison shows the university has higher representation of staff disclosing disability(ies) overall, and in almost all individual age groups, with more consistent representation throughout age groups. The same downward trend in representation into older age groups is also evident, although the university staff’s representation reduces less into older age groups.
The proportion who did not answer or selected 'prefer not to say' was higher among younger staff. It was highest among staff aged 25-44, and lowest among under 45s.
The main consideration in relation to HESA data is that the highest representation seen in HESA’s youngest category (9.9% of 25 and under) is the only age group where the university’s representation is lower. Less than 1% of University staff are under 25, compared to a 5.8% HESA comparison, indicating that the university is under-represented in the age group HESA data shows is most likely to experience disability(ies).
Proportion (%) of people with a disability by age group vs HESA
| Age Group | % OU | % HESA |
|---|---|---|
| 25 and under | 9.0% | 9.9% |
| 26 to 35 | 10.8% | 7.9% |
| 36 to 45 | 9.4% | 6.8% |
| 46 to 55 | 9.7% | 6.7% |
| 56 to 65 | 9.2% | 6.7% |
| 66 and over | 8.5% | 5.1% |
Disability representation is higher than the HESA benchmark across most age groups.
Disability - Recruitment
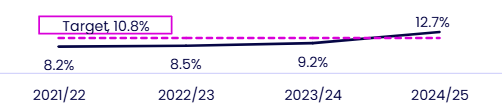
In 2024/25, candidates declaring a disability were increasingly represented at later stages of recruitment, rising from 9.7% of applicants to 12.7% of shortlisted candidates and 11.9% of appointments, exceeding the Equality Scheme shortlisting 2026 target of 10.8%. Disabled candidates were more likely to be shortlisted than those not declaring a disability, while appointment rates following interview were broadly comparable across groups.
% of Shortlisted vs Equality Scheme 2026 target
| Year | % with disability |
|---|---|
| 2021/22 | 8.2% |
| 2022/23 | 8.5% |
| 2023/24 | 9.2% |
| 2024/25 | 12.7% |
The proportion of shortlisted candidates disclosing a disability increased gradually and eventually exceeding the Equality Scheme 2026 target in 2024/25.
Recruitment pipeline representation
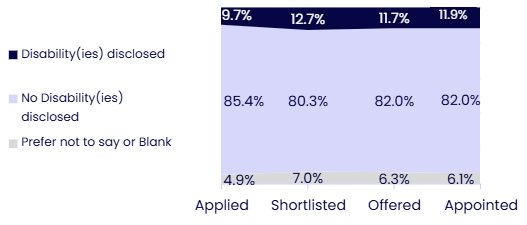
Disability(ies) | Applied | Shortlisted | Offered | Appointed | Proportion (of) applicants shortlisted | Proportion (of) applicants offered | Proportion (%) of shortlisted appointed after Interview | ||||
|---|---|---|---|---|---|---|---|---|---|---|---|
Number | % of total | Number | % of total | Number | % of total | Number | % of total | ||||
Disability(ies) disclosed | 1,184 | 9.7% | 253 | 12.7% | 74 | 11.7% | 70 | 11.9% | 21.4% | 6.3% | 27.7% |
No disability(ies) disclosed | 10,406 | 85.4% | 1,611 | 80.3% | 516 | 82.0% | 482 | 82.0% | 15.5% | 5.0% | 29.9% |
Prefer not to say or Blank | 603 | 4.9% | 141 | 7.0% | 40 | 6.3% | 36 | 6.1% | 23.4% | 6.6% | 25.5% |
Grand Total | 12,193 | 100.0% | 2,005 | 100.0% | 630 | 100.0% | 586 | 100.0% | 16.4% | 5.2% | 29.2% |
Contact us
Equality, Diversity and Inclusion
The Open University
Walton Hall
Milton Keynes
MK7 6AA
Email [email protected]


Explore

Undergraduate
Postgraduate
Policy
-
Follow us on Social media
-


