
Equality Scheme Targets 2022-2026 - Staff Monitoring Report 2024/25
2022-26 Equality Scheme Staff KPIs - at a glance
Senior Staff Diversity
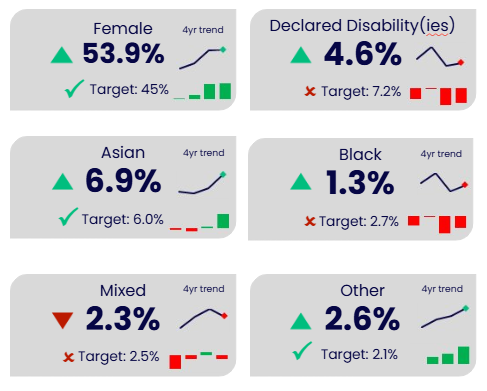
Female representation is 53.9% (target 45%), above target with an upward trend. Declared disabilities are 4.6% (target 7.2%), below target. Asian representation is 6.9% (target 6.0%), above target with an upward trend. Black representation is 1.3% (target 2.7%), below target. Mixed representation is 2.3% (target 2.5%), slightly below target with a recent decline. Other ethnic representation is 2.6% (target 2.1%), above target with an upward trend. Green upward pointing arrows icons indicate targets met, while red downward pointing arrows icons indicate targets not met.
Shortlisted Candidates
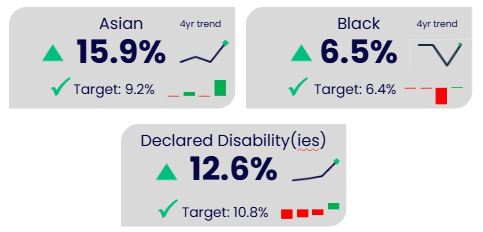
Asian representation is 15.9% (target 9.2%), above target with an upward trend. Black representation is 6.5% (target 6.4%), slightly above target. Declared disability(ies) is 12.6% (target 10.8%) above target with an upward trend. Green upward pointing arrows icons indicate targets met, while red downward pointing arrows icons indicate targets not met.
Appointed Candidates
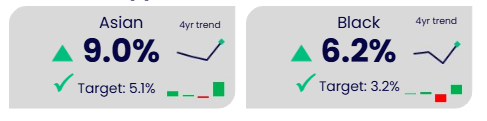
Asian representation is 9.0% (target 5.1%), above target with an upward trend. Black representation is 6.2% (target 3.2%), above target with an upward trend. Green upward pointing arrows icons indicate targets met, while red downward pointing arrows icons indicate targets not met.
8 out of 11 KPIs (72.7%) are on or above target.
The largest gaps relate to staff declaring Disability(ies) in senior roles, and Black staff in senior roles.
Recruitment outcomes for Asian and Black candidates show substantial improvement.
2022-26 Equality Scheme Staff KPIs
The Equality Scheme set out 11 staff KPIs to increase the representation of disabled and racially minoritised staff in senior roles and in recruitment stages. All but one measure has increased year-on-year, and 8 of the 11 (72.7%) staff KPIs have met or exceeded targets. Three are below target, with the largest gap from targets relating to senior level representation of staff declaring Disability(ies), and senior Black staff – currently at less than half of the target percentage, and senior disabled representation over a third below target. Further data and context can be found in the following pages.
| Equality Scheme Staff KPIs | Baseline | Target | Previous year (2023/24) | Current year (2024/25) | Year on Year difference (percentage points - ppts) | Difference from target (%) |
|---|---|---|---|---|---|---|
Maintain an overall female staff representation in senior roles | 47.7% | Minimum of 45% | 53.6% | 53.9% | +0.3 ppts | ▲ 19.8% |
An increased proportion of staff with declared Disability(ies) in senior roles | 4.2% | 7.2% | 4.4% | 4.6% | +0.2 ppts | ▼ 36.1% |
An increased proportion of Asian staff in senior roles | 5.6% | 6.0% | 6.1% | 6.9% | +0.8 ppts | ▲ 15.0% |
An increased proportion of Black staff in senior roles | 1.7% | 2.7% | 1.0% | 1.3% | +0.3 ppts | ▼ 51.9% |
An increased proportion of Mixed staff in senior roles | 2.1% | 2.5% | 2.7% | 2.3% | -0.4 ppts | ▼ 8.0% |
An increased proportion of Other minority ethnic staff in senior roles | 1.7% | 2.1% | 2.4% | 2.6% | +0.2 ppts | ▲ 3.8% |
% of candidates shortlisted of disclosed Disability(ies) | 7.6% | 10.8% | 9.2% | 12.6% | +3.4 ppts | ▲ 16.7% |
% of candidates shortlisted of Asian ethnicity | 8.8% | 9.2% | 9.0% | 15.9% | +6.9 ppts | ▲ 72.8% |
% of candidates shortlisted of Black ethnicity | 5.6% | 6.4% | 2.6% | 6.5% | +3.9 ppts | ▲ 1.6% |
% of candidates appointed of Asian ethnicity | 4.9% | 5.1% | 4.6% | 9.0% | +4.4 ppts | ▲ 76.5% |
% of candidates appointed of Black ethnicity | 2.8% | 3.2% | 0.6% | 6.2% | +5.6 ppts | ▲ 93.8% |
Baseline data taken as at the 31st March 2022 | Targets set to achieve by April 2026 | Previous Year = as at 31st July 2024 | Current Year = as at 31st July 2025
Contact us
Equality, Diversity and Inclusion
The Open University
Walton Hall
Milton Keynes
MK7 6AA
Email [email protected]


Explore

Undergraduate
Postgraduate
Policy
-
Follow us on Social media
-


