
Sexual Orientation - Staff Monitoring Report 2021/22
Sexual Orientation 2021/22
Proportion % by Sexual Orientation in 2021/22
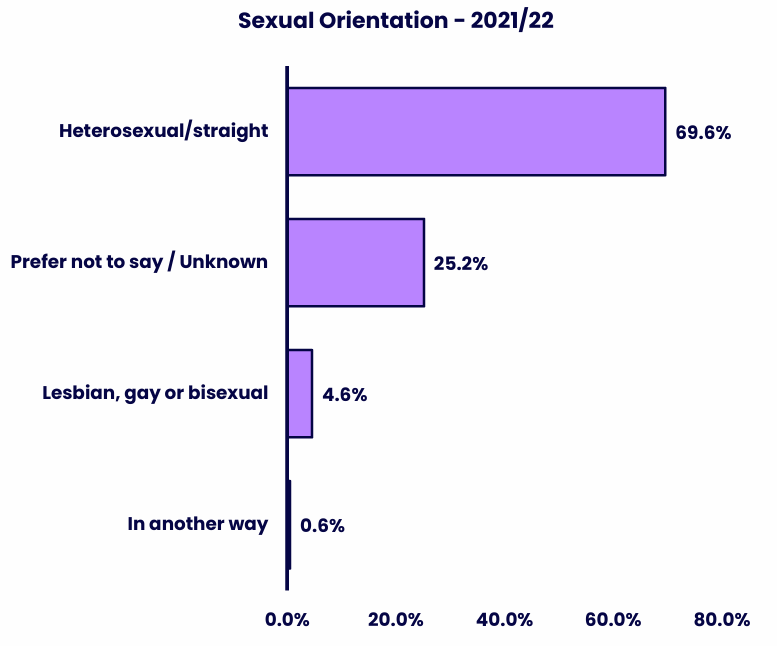
| Sexual orientation | % |
|---|---|
| Heterosexual/straight | 69.6% |
| Prefer not to say/Unknown | 25.2% |
| Lesbian, gay or bisexual | 4.6% |
| In another way | 0.6% |
Majority of staff are heterosexual or straight.
Scope: All Staff (please see inclusion/exclusion table)
Snapshot date: 31st July 2022 (Academic Year 2021/22)
Proportion % by Sexual Orientation (LGB+ subgroup) 2021/22
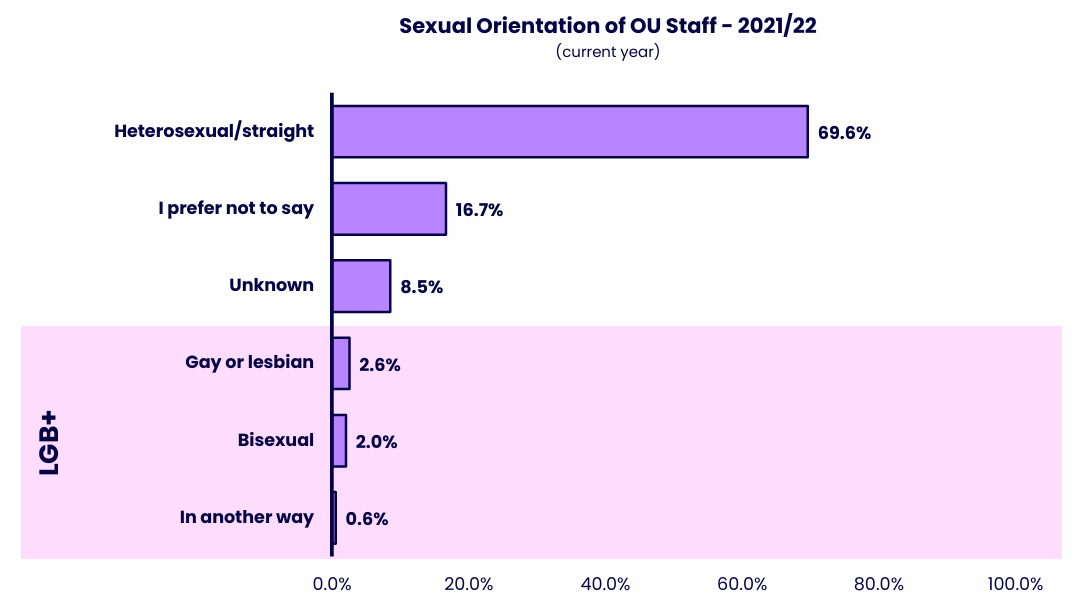
| Sexual orientation | % |
|---|---|
| Heterosexual/straight | 69.6% |
| Prefer not to say | 16.7% |
| Unknown | 8.5% |
| Gay or lesbian | 2.6% |
| Bisexual | 2.0% |
| In another way | 0.6% |
Within LGB+, about a similar proportion is Gay or lesbian / Bisexual.
Snapshot date(s): 2021/22 (as at 31st July 2022)
Scope: All Staff –Academic Staff (Central, Regional, Researcher & ALs) and Professional & Support Staff –data does not include OU subsidiaries (OUSA, OUW, Mulberry Bear) or agency/temp workers.
Population and Disclosure Rate over 5 years
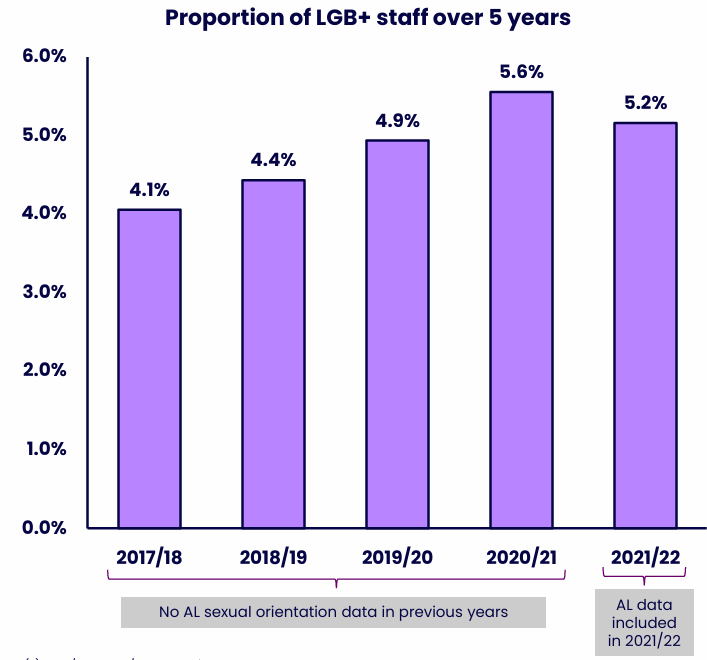
| Year | % |
|---|---|
| 2017/18 | 4.1% |
| 2018/19 | 4.4% |
| 2019/20 | 4.9% |
| 2020/21 | 5.6% |
| 2021/22 | 5.2% |
The proportion of LGB+ staff has been increasing over time.
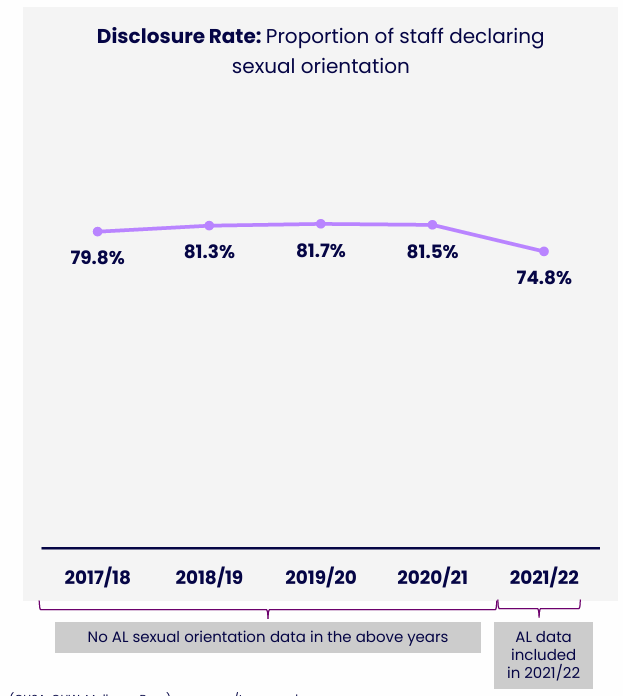
| Year | % disclosure |
|---|---|
| 2017/18 | 79.8% |
| 2018/19 | 81.3% |
| 2019/20 | 81.7% |
| 2020/21 | 81.5% |
| 2021/22 | 74.8% |
The proportion of disclosure rate has been going up until the most recent year, when the AL data is added.
LGB+ = lesbian, gay, bisexual and other non-heterosexual orientation
AL data not available for years prior to 2021/22
Snapshot date(s): 2017/18 to 2021/22 as at 31st July of each year.
Scope: All Staff – Academic Staff (Central, Regional, Researcher & ALs) and Professional & Support Staff – data does not include OU subsidiaries (OUSA, OUW, Mulberry Bear) or agency/temp workers.
Sexual Orientation by Employee Subgroup and Disclosure Rate
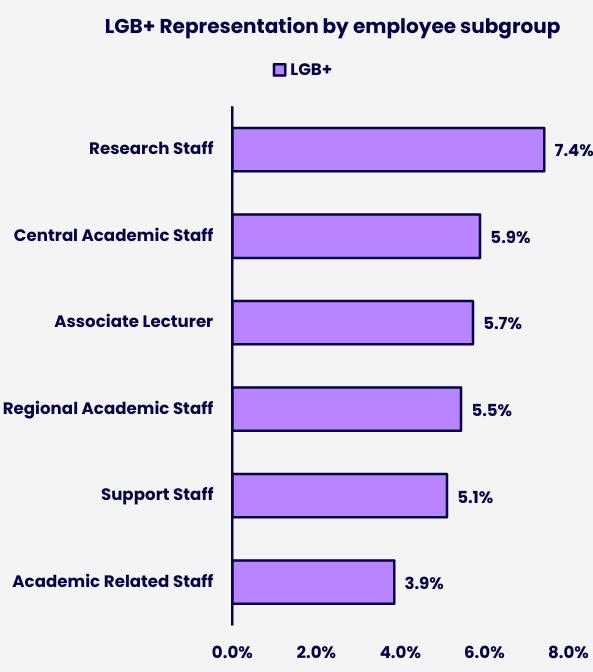
| Employee subgroup | % LGB+ |
|---|---|
| Research Staff | 7.4% |
| Central Academic Staff | 5.9% |
| Associate Lecturer | 5.7% |
| Regional Academic Staff | 5.5% |
| Support Staff | 5.1% |
| Academic Related Staff | 3.9% |
Proportion of LGB+ is highest among Research Staff and lowest among Academic Related Staff.
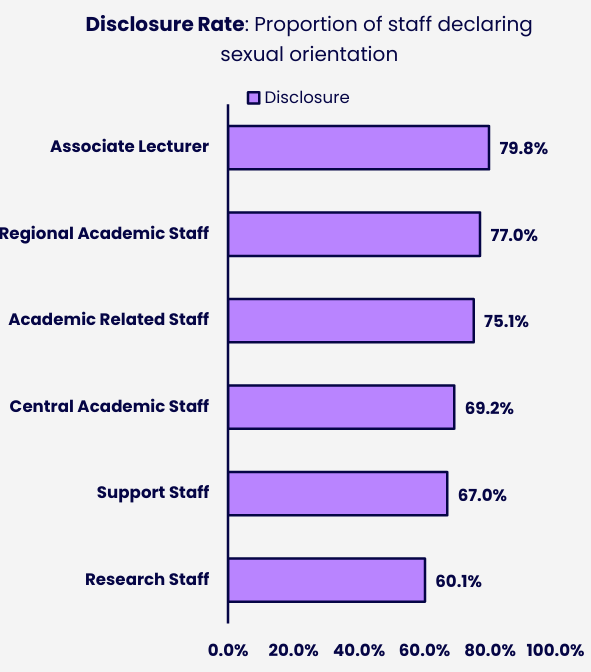
| Employee subgroup | % Disclosure rate |
|---|---|
| Associate Lecturer | 79.8% |
| Regional Academic Staff | 77.0% |
| Academic Related Staff | 75.1% |
| Central Academic Staff | 69.2% |
| Support Staff | 67.0% |
| Research Staff | 60.1% |
Disclosure is highest in Associate Lecturer and lowest in Research Staff.
Snapshot date(s): 2021/22 (as at 31st July 2022)
Scope: All Staff –Academic Staff (Central, Regional, Researcher & ALs) and Professional & Support Staff –data does not include OU subsidiaries (OUSA, OUW, Mulberry Bear) or agency/temp workers.
Contact us
Equality, Diversity and Inclusion
The Open University
Walton Hall
Milton Keynes
MK7 6AA
Email [email protected]


Explore

Undergraduate
Postgraduate
Policy
-
Follow us on Social media
-


