
Disability - Staff Monitoring Report 2021/22
Disability 2021/22
Proportion % by Disability Declaration in 2021/22
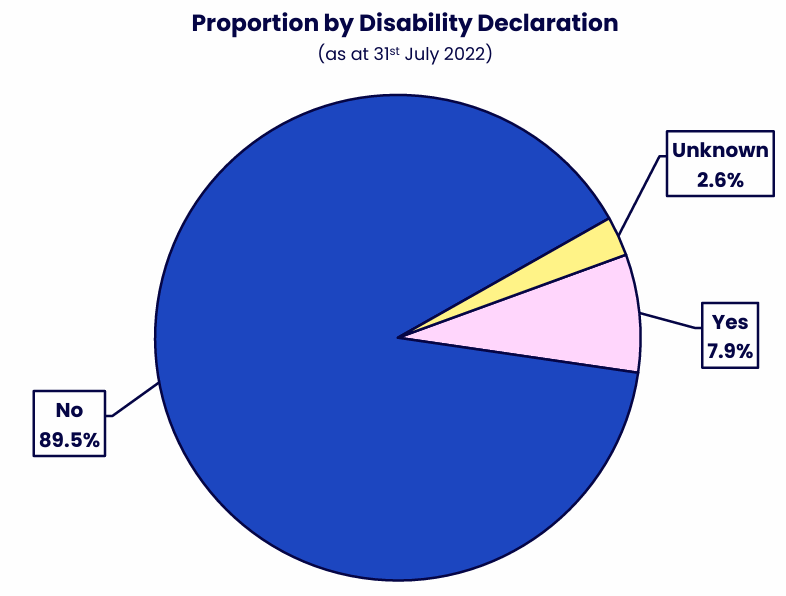
| Disability declaration | % |
|---|---|
| Yes | 7.9% |
| No | 89.5% |
| No data | 2.6% |
Most staff reported that they did not have a disability.
Scope: All Staff (please see inclusion/exclusion table)
Snapshot date: 31stJuly 2022 (Academic Year 2021/22)
Population and Disclosure Rate over 5 years
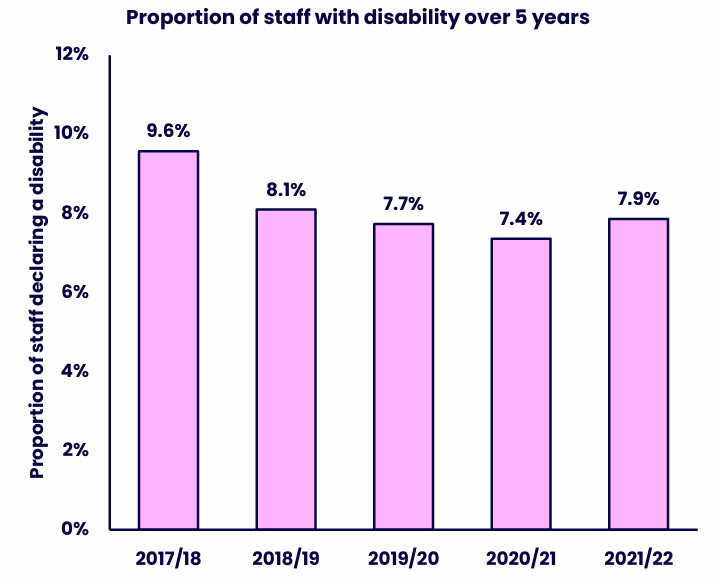
| Year | % Staff with disability |
|---|---|
| 2017/18 | 9.6% |
| 2018/19 | 8.1% |
| 2019/20 | 7.7% |
| 2020/21 | 7.4% |
| 2021/22 | 7.9% |
Disability declaration shows a slight decreasing trend before rising slightly in the most recent year.
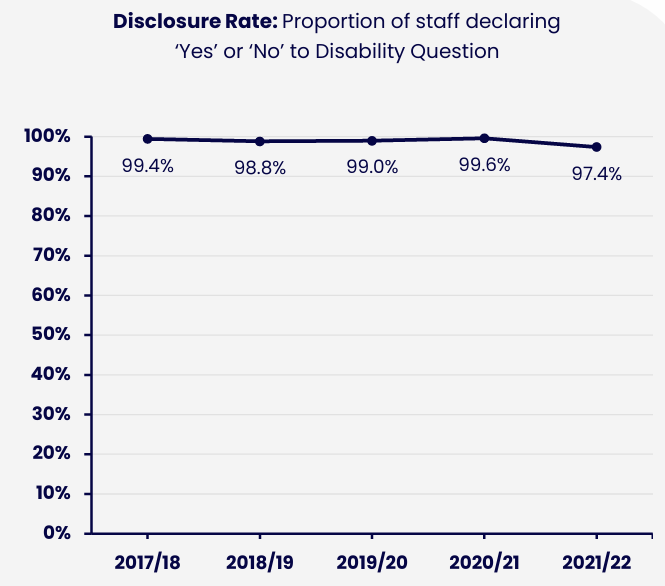
| Year | % Disclosure rate |
|---|---|
| 2018/19 | 99.4% |
| 2018/19 | 98.8% |
| 2019/20 | 99.0% |
| 2020/21 | 99.6% |
| 2021/22 | 97.4% |
The disability disclosure rate remained consistently high.
Snapshot date(s): 2017/18 to 2021/22 as at 31st July of each year.
Scope: All Staff – Academic Staff (Central, Regional, Researcher & ALs) and Professional & Support Staff – data does not include OU subsidiaries (OUSA, OUW, Mulberry Bear) or agency/temp workers.
Disability by Employee Group
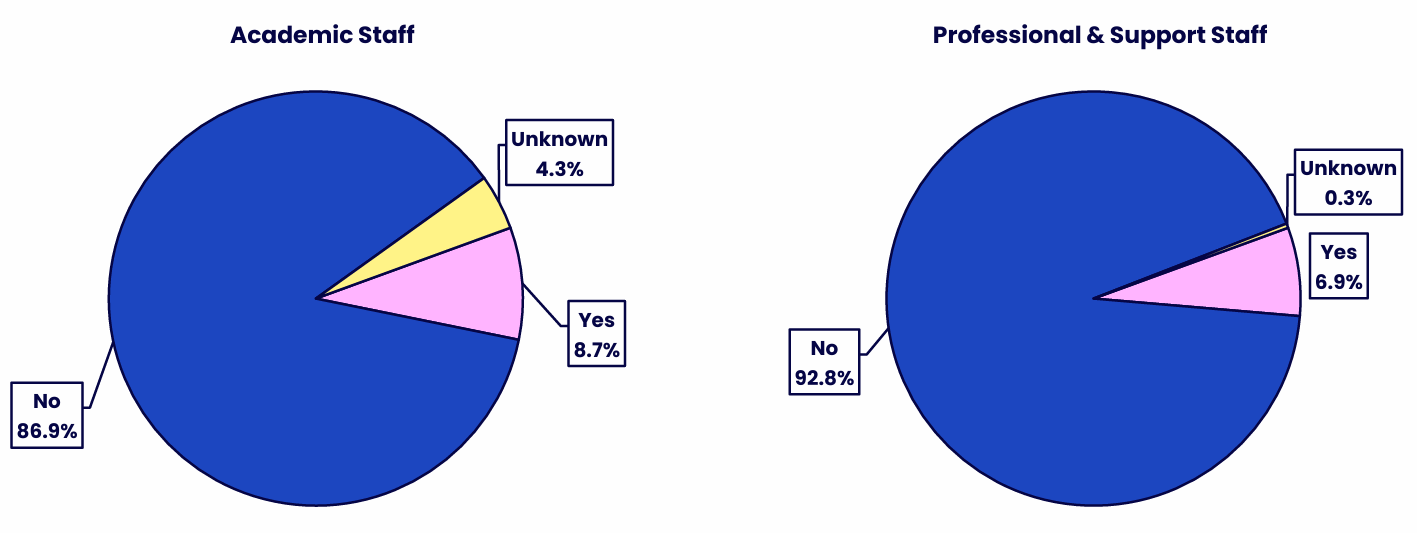
| Disability | Academic Staff | Professional & Support Staff |
|---|---|---|
| Yes | 8.7% | 6.9% |
| No | 86.9% | 92.8% |
| Unknown | 4.3% | 0.3% |
Academic Staff have a higher proportion of staff declaring a disability than Professional & Support Staff.
Snapshot date(s): 2021/22 (as at 31stJuly 2022)
Scope: All Staff –Academic Staff (Central, Regional, Researcher & ALs) and Professional & Support Staff –data does not includeOU subsidiaries (OUSA, OUW, Mulberry Bear) or agency/temp workers.
Disability by Employee Subgroup and intersectionality
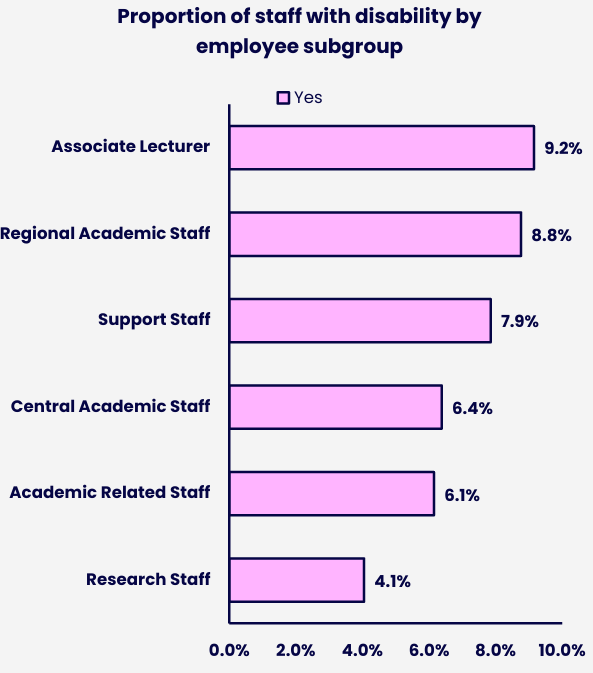
| Employee Subgroup | % staff with disability |
|---|---|
| Associate Lecturer | 9.2% |
| Regional Academic Staff | 8.8% |
| Support Staff | 7.9% |
| Central Academic Staff | 6.4% |
| Academic Related Staff | 6.1% |
| Research Staff | 4.1% |
Disability declaration varies across employee subgroups, with Associate Lecturers and Regional Academic Staff showing the highest levels of declaration and Research Staff showing the lowest.
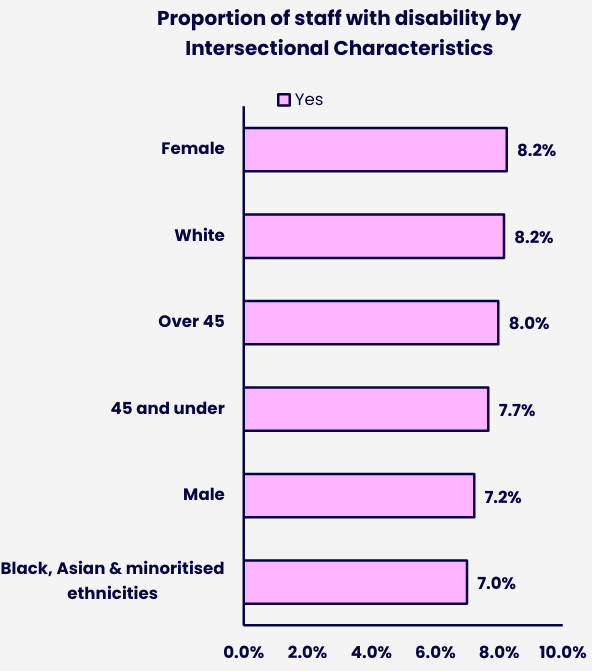
| Intersectional characteristics | % staff with disability |
|---|---|
| Female | 8.2% |
| White | 8.2% |
| Over 45 | 8.0% |
| 45 and under | 7.7% |
| Male | 7.2% |
| Black, Asian & minoritised ethnicities | 7.0% |
Proportion of staff with disabilities vary slightly by different intersectional characteristics.
Snapshot date(s): 2021/22 (as at 31stJuly 2022)
Scope: All Staff –Academic Staff (Central, Regional, Researcher & ALs) and Professional & Support Staff –data does not include OU subsidiaries (OUSA, OUW, Mulberry Bear) or agency/temp workers.
Representation at senior level (equity target)
As at 31stJuly 2022, colleagues with one or more declared disabilities represented 4.9% of staff at senior level, a 1.4 percentage point increase from the previous year (2020/21). There is a larger proportion of disabled staff in professor bands (5.7%) than in SS grades (3.8%). We are 2.3% below our 2025 equity target.
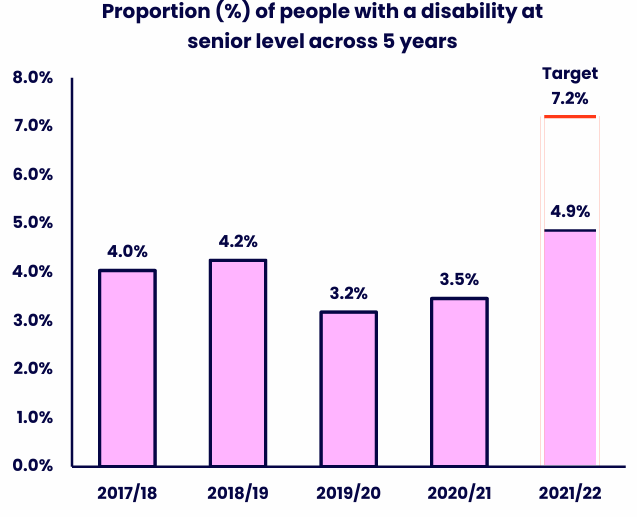
| Year | % Disclosure rate |
|---|---|
| 2017/18 | 4.0% |
| 2018/19 | 4.2% |
| 2019/20 | 3.2% |
| 2020/21 | 3.5% |
| 2021/22 | 4.9% |
Disability representation at senior level has slightly increased over time, but remained below the 7.2% target in 2021/22.
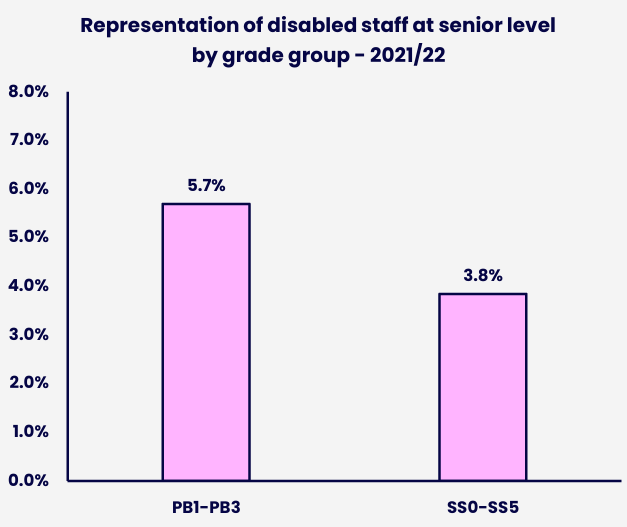
| Grades | % Disclosure rate |
|---|---|
| PB1-PB3 | 5.7% |
| SS0-SS5 | 3.8% |
Disabled staff are more highly represented in the PB1–PB3 grade group than in SS0–SS5.
Snapshot date(s): 2017/18 to 2021/22 as at 31stJuly of each year (above chart) | 2021/22 (as at 31stJuly 2022; below chart)
Scope: Staff with ‘SS’ (Senior Staff) grades or ‘PB’ (Professor) grades
Contact us
Equality, Diversity and Inclusion
The Open University
Walton Hall
Milton Keynes
MK7 6AA
Email [email protected]


Explore

Undergraduate
Postgraduate
Policy
-
Follow us on Social media
-


