
Sex - Staff Monitoring Report 2021/22
Sex 2021/22
Our current staff records only collect binary sex data (male, female)
Proportion of men and women in 2021/22
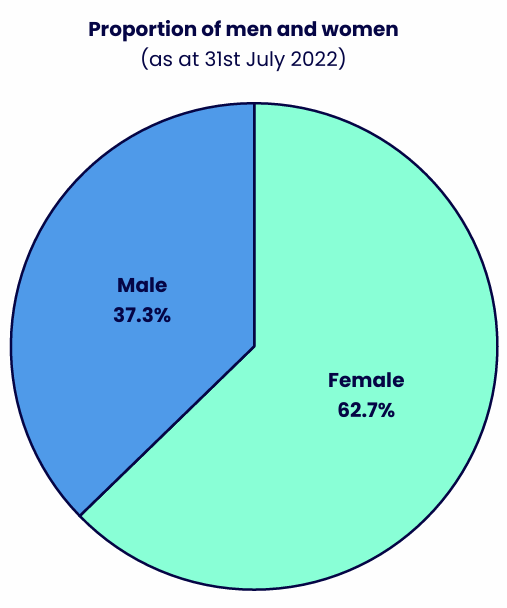
| Sex | % |
|---|---|
| Female | 62.7% |
| Male | 37.3% |
Women make up the majority of the workforce.
Scope: All Staff (please see inclusion/exclusion table)
Snapshot date: 31st July 2022 (Academic Year 2021/22)
Proportion of men and women over five years
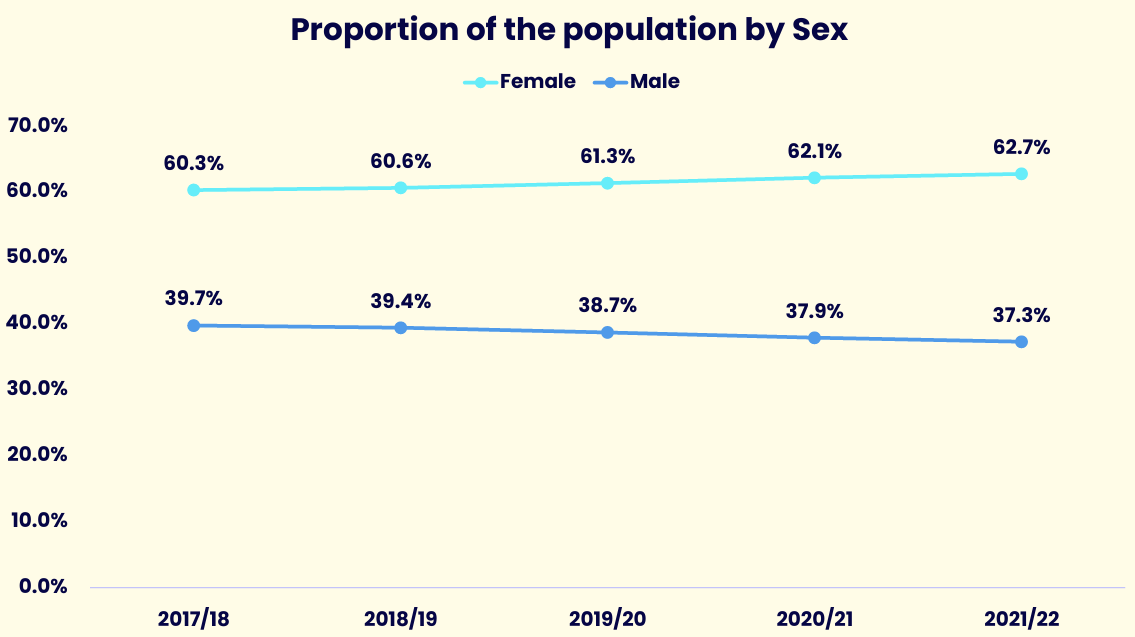
| Year | % Female | % Male |
|---|---|---|
| 2017/18 | 60.3% | 39.7% |
| 2018/19 | 60.6% | 39.4% |
| 2019/20 | 61.3% | 38.7% |
| 2020/21 | 62.1% | 37.9% |
| 2021/22 | 62.7% | 37.3% |
The workforce remained predominantly female throughout the period.
Snapshot date(s): 2017/18 to 2021/22 as at 31st July of each year.
Scope: All Staff – Academic Staff (Central, Regional, Researcher & ALs) and Professional & Support Staff – data does not include OU subsidiaries (OUSA, OUW, Mulberry Bear) or agency/temp workers.
Sex by Employee Group
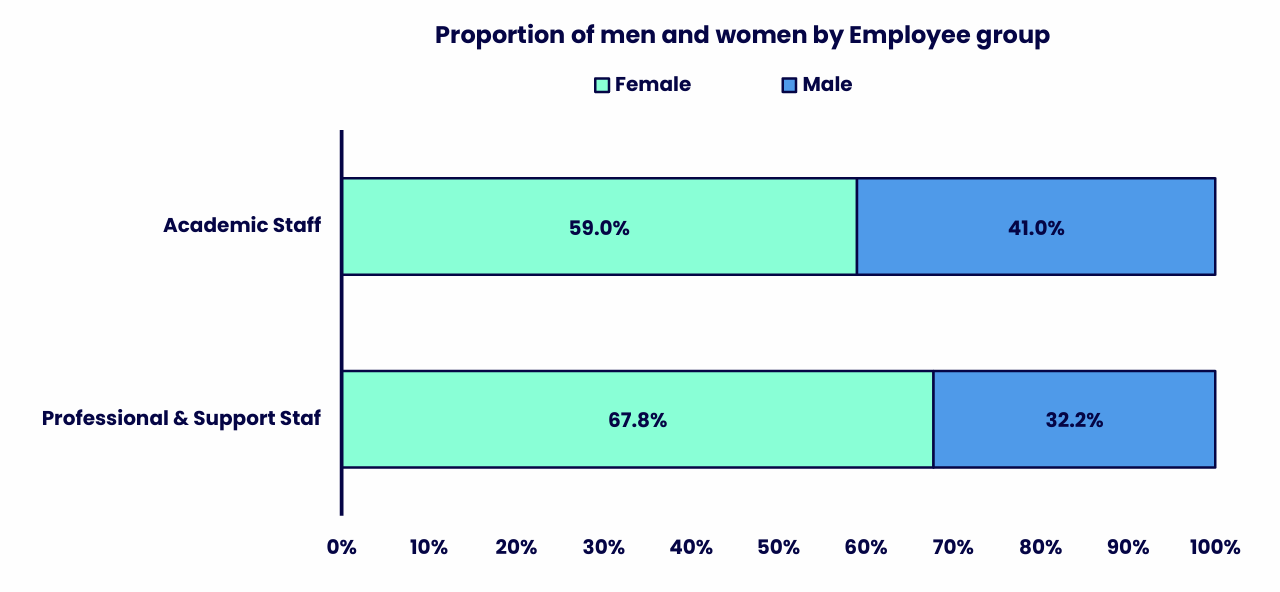
| Employee Group | % Woman | % Man |
|---|---|---|
| Academic Staff | 59.0% | 41.0% |
| Professional & Support Staff | 67.8% | 32.2% |
Both employee groups are predominantly female.
Snapshot date(s): 2021/22 (as at 31st July 2022)
Scope: All Staff –Academic Staff (Central, Regional, Researcher & ALs) and Professional & Support Staff –data does not include OU subsidiaries (OUSA, OUW, Mulberry Bear) or agency/temp workers.
Sex by Employee Subgroup
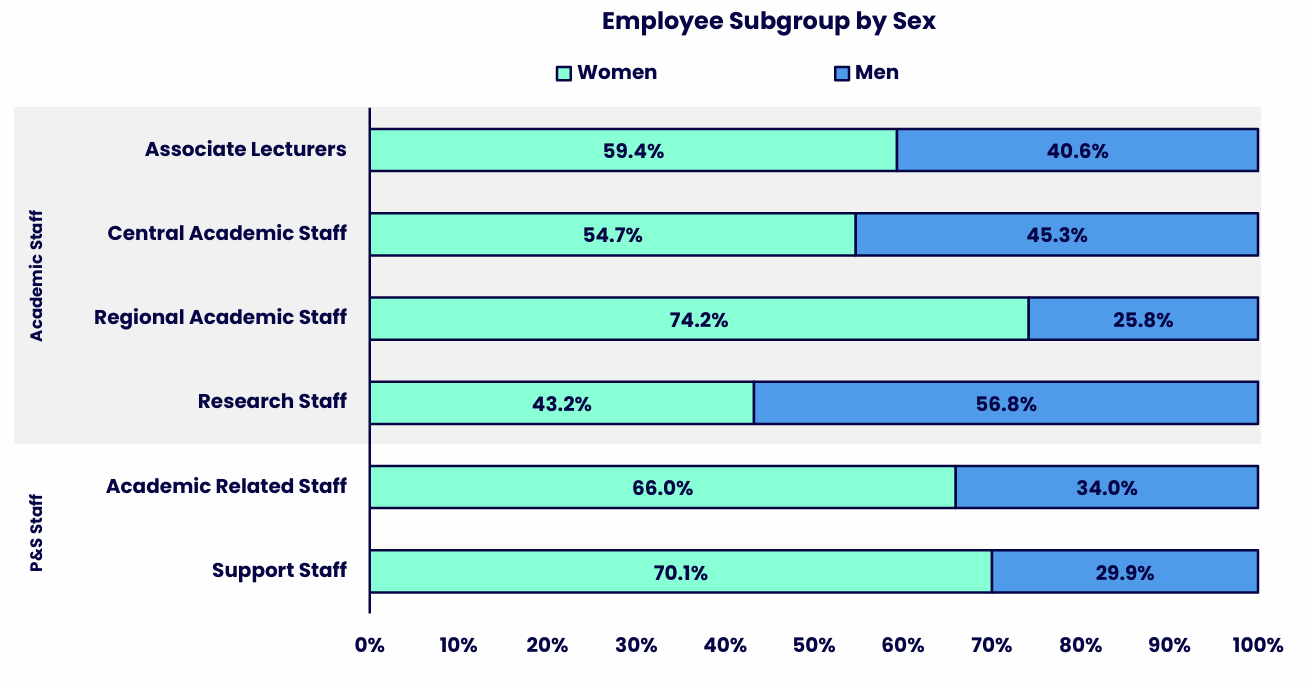
| Employee Subgroup | % Woman | % Man |
|---|---|---|
| Associate Lecturer | 59.4% | 40.6% |
| Central Academic Staff | 54.7% | 45.3% |
| Regional Academic Staff | 74.2% | 25.8% |
| Research Staff | 43.2% | 56.8% |
| Academic Related Staff | 66.0% | 34.0% |
| Support Staff | 70.1% | 29.9% |
Women are the majority in most employee subgroups.
Snapshot date(s): 2021/22 (as at 31st July 2022)
Scope: All Staff –Academic Staff (Central, Regional, Researcher & ALs) and Professional & Support Staff –data does not include OU subsidiaries (OUSA, OUW, Mulberry Bear) or agency/temp workers.
Representation of women at senior level
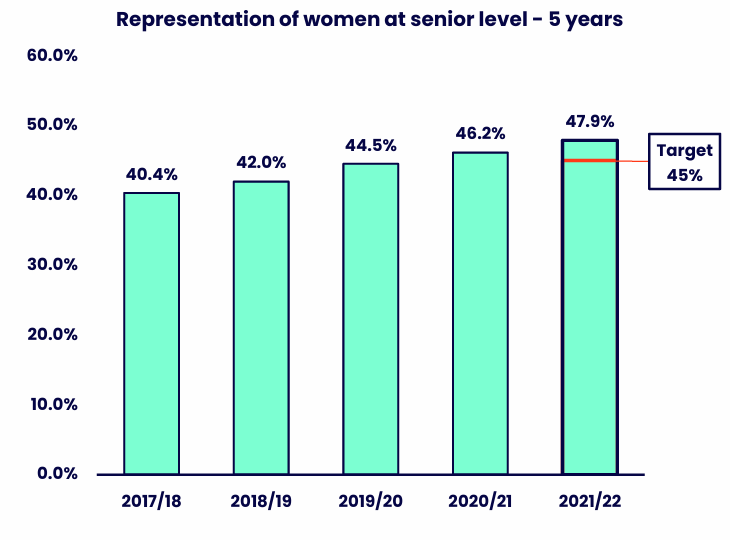
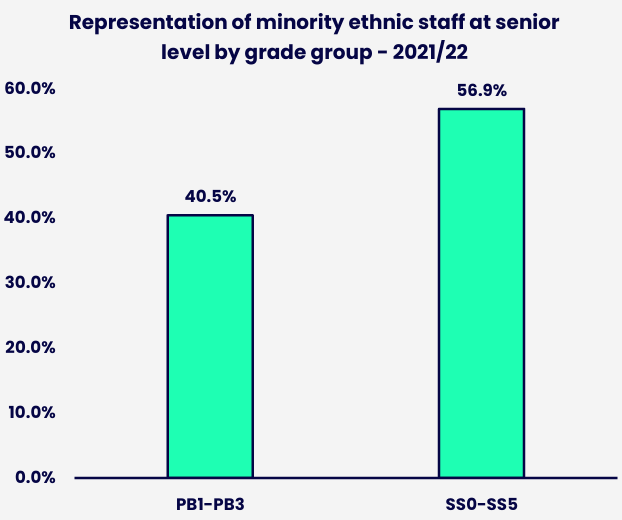
There has been continual upward progress in improving the proportion of women in senior roles with women now accounting for 47.9% of senior staff, the highest representation in 5 years. Women are underrepresented in the professor bands particularly in Professor Band 2 (women in PB1 =43.0%; PB2= 34.1%, PB3=42.9%).
| Year | % Female |
|---|---|
| 2017/18 | 40.4% |
| 2018/19 | 42.0% |
| 2019/20 | 44.5% |
| 2020/21 | 46.2% |
| 2021/22 | 47.9% |
Female representation at senior level increased steadily throughout the period and exceeded the target in the most recent year shown.
| Year | % Female |
|---|---|
| PB1-PB3 | 40.5% |
| SS0-SS5 | 56.9% |
Women are represented in both senior grade groups, with a higher level of representation in the SS0-SS5 grade group than in the PB1-PB3 grade group.
Snapshot date(s): 2017/18 to 2021/22 as at 31st July of each year (above chart) | 2021/22 (as at 31stJuly 2022; below chart)
Scope: Staff with ‘SS’ (Senior Staff) grades or ‘PB’ (Professor) grades
Parental Leave and Return Rate
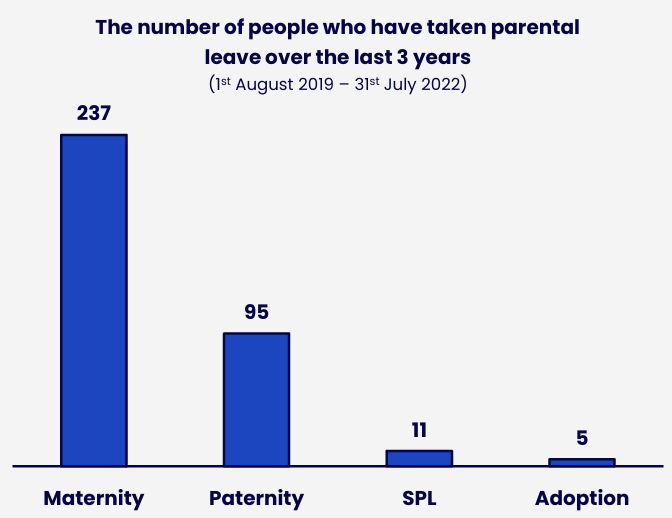
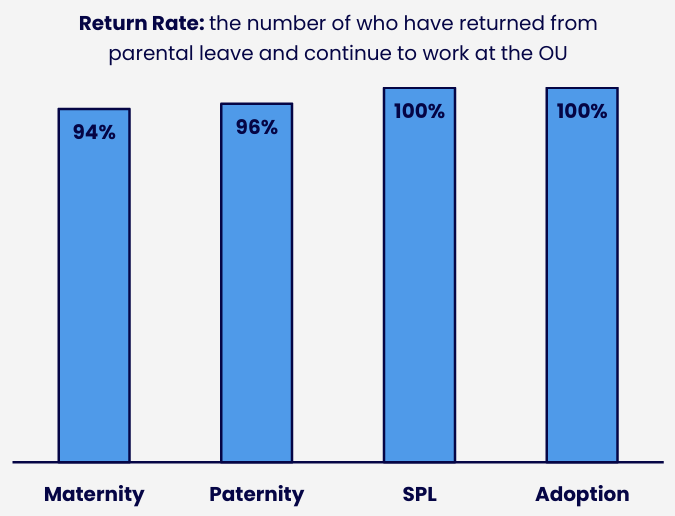
Over the past three years, 340 employees have taken parental leave, led largely by maternity leave uptake. The large majority of people whose parental leave ended on or before 31stJuly 2022 have returned and continue to work at the OU. The maternity return rate (94%) is slightly lower than other parental leave types.
| Type of parental leave | Number of staff |
|---|---|
| Maternity | 237 |
| Paternity | 95 |
| SPL | 11 |
| Adoption | 5 |
Majority of staff taking parental leave are maternity leave.
| Type of parental leave | % returned to work |
|---|---|
| Maternity | 94% |
| Paternity | 96% |
| SPL | 100% |
| Adoption | 100% |
Almost all staff who went on parental leave returned to work.
Return rate is based on employees whose expected parental leave return date ended within the reporting period (on or before 31st July 2022). Staff who are still on parental leave have not been included in the return rate.
Snapshot date(s): data captures parental leave start dates that fall anywhere between 1stAugust 2019 to 31st July 2022.
Scope: All Staff –Academic Staff (Central, Regional, Researcher & ALs) and Professional & Support Staff –data does not include OU subsidiaries (OUSA, OUW, Mulberry Bear) or agency/temp workers.
Contact us
Equality, Diversity and Inclusion
The Open University
Walton Hall
Milton Keynes
MK7 6AA
Email [email protected]


Explore

Undergraduate
Postgraduate
Policy
-
Follow us on Social media
-


