
Age - Staff Monitoring Report 2021/22
Age 2021/22
The current (2021/22) OU population by age group
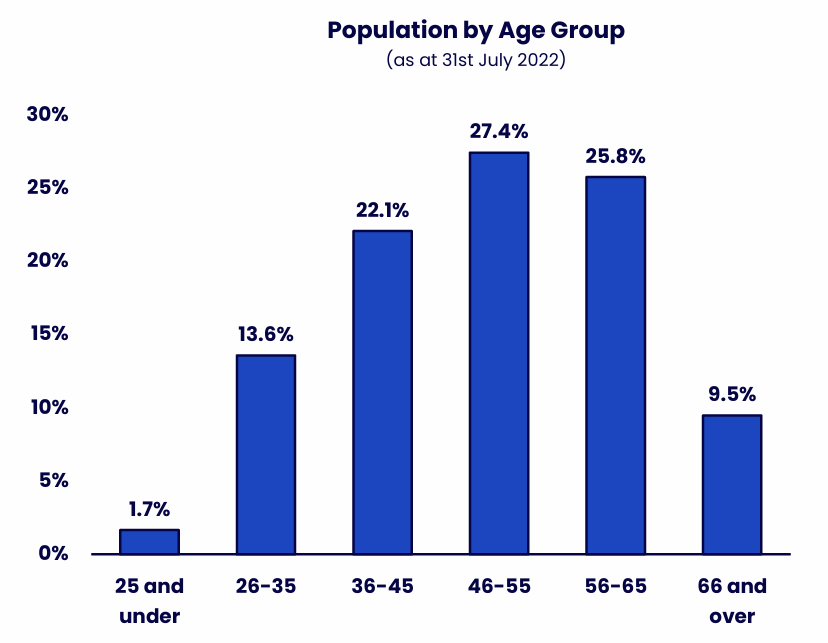
| Age Group | % |
|---|---|
| 25 and under | 1.7% |
| 26 to 35 | 13.6% |
| 36 to 45 | 22.1% |
| 46 to 55 | 27.4% |
| 56 to 65 | 25.8% |
| 66 and over | 9.5% |
The workforce is concentrated in the middle and later career age groups.
Scope: All Staff (please see inclusion/exclusion table)
Snapshot date: 31stJuly 2022 (Academic Year 2021/22)
Current Year (2021/22) and percentage change from previous year (2020/21)
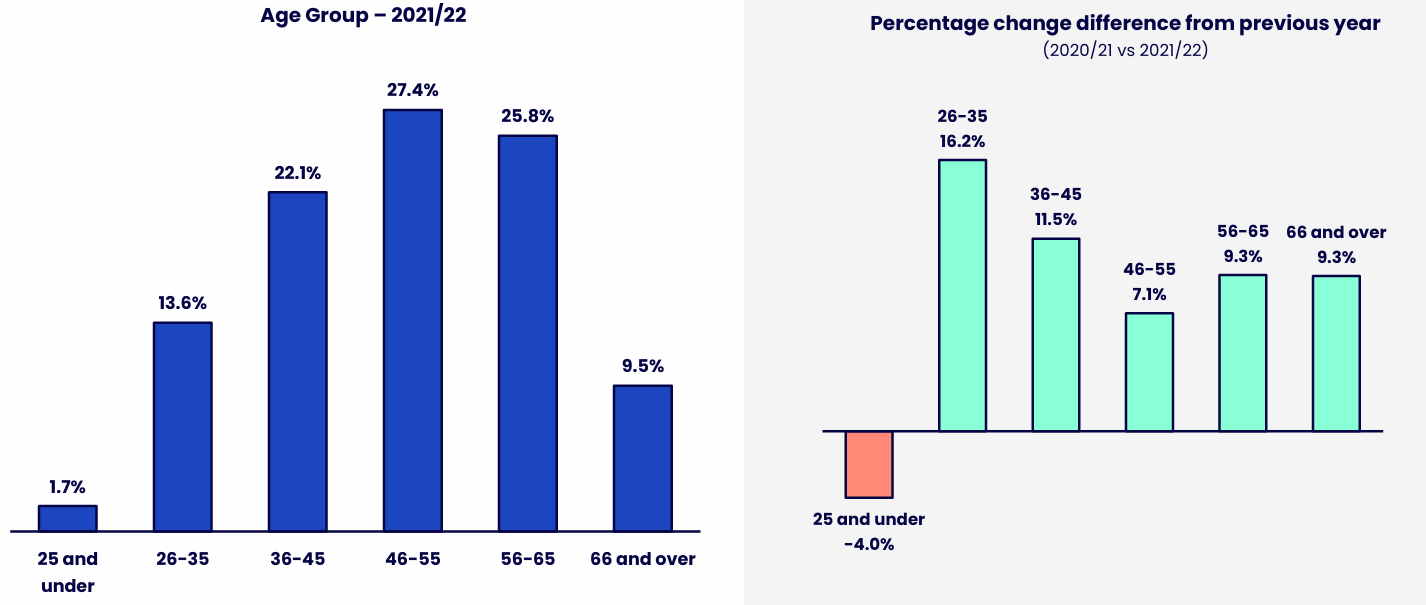
| Age Group | % change |
|---|---|
| 25 and under | -4.0% |
| 26 to 35 | 16.2% |
| 36 to 45 | 11.5% |
| 46 to 55 | 7.1% |
| 56 to 65 | 9.3% |
| 66 and over | 9.3% |
While there is a decrease in the proportion of staff aged 25 and under, the other age groups show an increase from last year.
Snapshot date(s): 2021/22 compared to 2020/21 population data (as at 31stJuly of each year).
Scope: All Staff –Academic Staff (Central, Regional, Researcher & ALs) and Professional & Support Staff –data does not include OU subsidiaries (OUSA, OUW, Mulberry Bear) or agency/temp workers.
Age Group by Employee Group
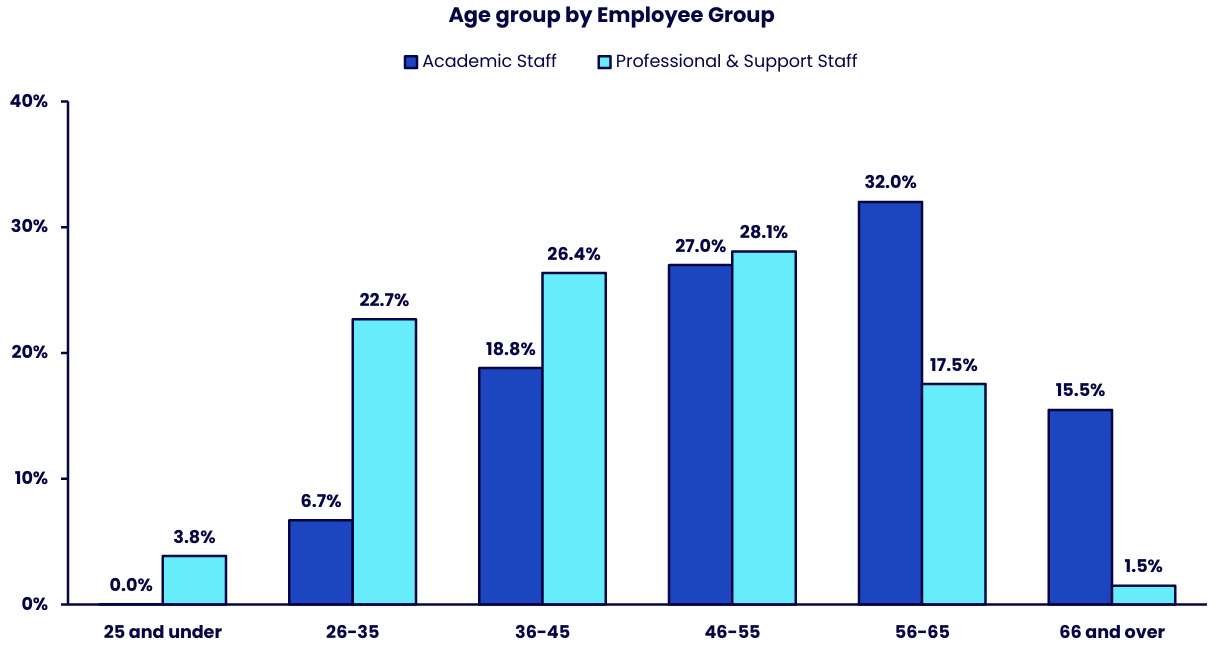
| Age Group | Academic Staff | Professional & Support Staff |
|---|---|---|
| 25 and under | 0.0% | 3.8% |
| 26 to 35 | 6.7% | 22.7% |
| 36 to 45 | 18.8% | 26.4% |
| 46 to 55 | 27.0% | 28.1% |
| 56 to 65 | 32.0% | 17.5% |
| 66 and over | 15.5% | 1.5% |
Professional & Support Staff have a younger age profile than Academic Staff.
Snapshot date(s): 2021/22 (as at 31stJuly 2022)
Scope: All Staff –Academic Staff (Central, Regional, Researcher & ALs) and Professional & Support Staff –data does not include OU subsidiaries (OUSA, OUW, Mulberry Bear) or agency/temp workers
Average Age by Employee Subgroup
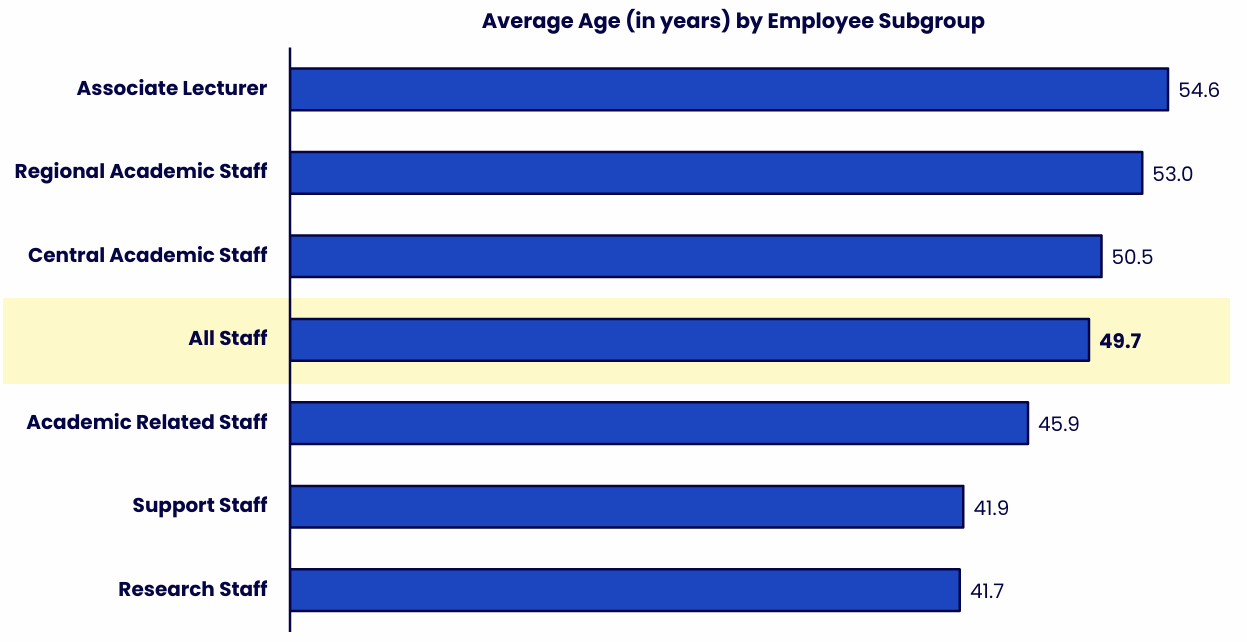
| Employee subgroup | Average age |
|---|---|
| Associate Lecturer | 54.6 |
| Regional Academic Staff | 53.0 |
| Central Academic Staff | 50.5 |
| All colleagues | 49.7 |
| Academic Related Staff | 45.9 |
| Support Staff | 41.9 |
| Research Staff | 41.7 |
Associate Lecturers and Regional Academic Staff have the oldest age profiles.
Snapshot date(s): 2021/22 (as at 31stJuly 2022)
Scope: All Staff –Academic Staff (Central, Regional, Researcher & ALs) and Professional & Support Staff –data does not include OU subsidiaries (OUSA, OUW, Mulberry Bear) or agency/temp workers.
Contact us
Equality, Diversity and Inclusion
The Open University
Walton Hall
Milton Keynes
MK7 6AA
Email [email protected]


Explore

Undergraduate
Postgraduate
Policy
-
Follow us on Social media
-


