
Ethnicity - Staff Monitoring Report 2021/22
Ethnicity 2021/22
Proportion % by Ethnicity Group in 2021/22
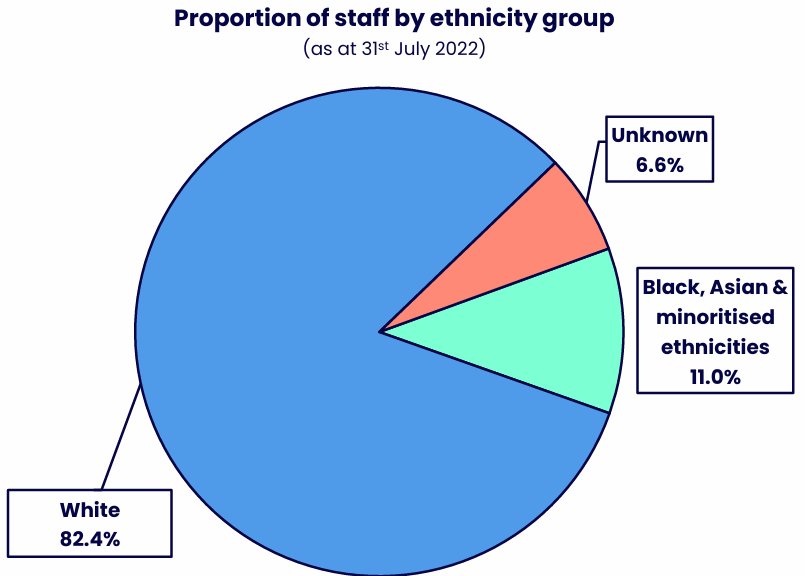
| Ethnicity group | % |
|---|---|
| Black, Asian & minoritised ethnicities | 11.0% |
| White | 82.4% |
| No data | 6.6% |
The majority of staff is White.
Ethnicity Group = Black, Asian and minoritised ethnicities
Scope: All Staff (please see inclusion/exclusion table)
Snapshot date: 31stJuly 2022 (Academic Year 2021/22)
Population and Disclosure Rate over 5 years
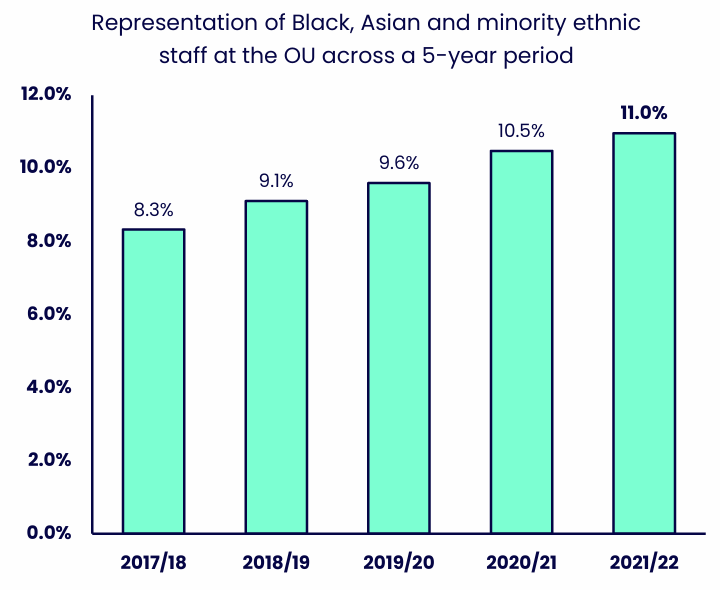
| Year | % Black, Asian and minority ethnic staff |
|---|---|
| 2018/19 | 8.3% |
| 2018/19 | 9.1% |
| 2019/20 | 9.6% |
| 2020/21 | 10.5% |
| 2021/22 | 11.0% |
Representation of Black, Asian and minority ethnic staff increased steadily over the five-year period.
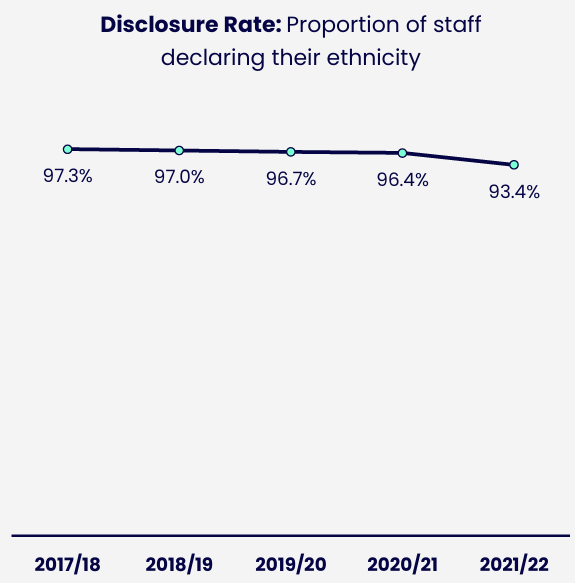
| Year | % disclosed ethnicity |
|---|---|
| 2017/18 | 97.3% |
| 2018/19 | 97.0% |
| 2019/20 | 96.7% |
| 2020/21 | 96.4% |
| 2021/22 | 93.4% |
Ethnicity disclosure rates remained high and stable over the five-year period.
Snapshot date(s): 2017/18 to 2021/22 as at 31st July of each year.
Scope: All Staff – Academic Staff (Central, Regional, Researcher & ALs) and Professional & Support Staff – data does not include OU subsidiaries (OUSA, OUW, Mulberry Bear) or agency/temp workers.
Ethnicity subgroup and Nationality
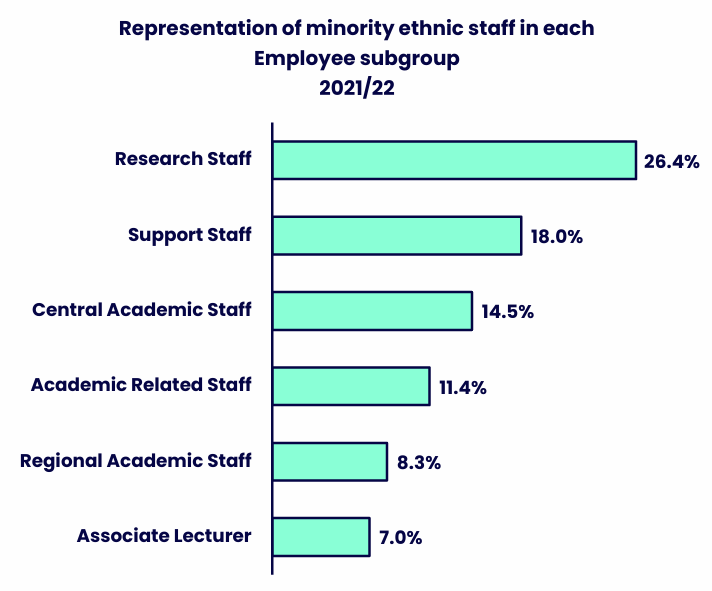
| Employee Subgroup | % Racially minoritised staff |
|---|---|
| Research Staff | 26.4% |
| Support Staff | 18.0% |
| Central Academic Staff | 14.5% |
| Academic Related Staff | 11.4% |
| Regional Academic Staff | 8.3% |
| Associate Lecturer | 7.0% |
Representation of minority ethnic staff varies across employee subgroups, with Research Staff showing the highest representation.
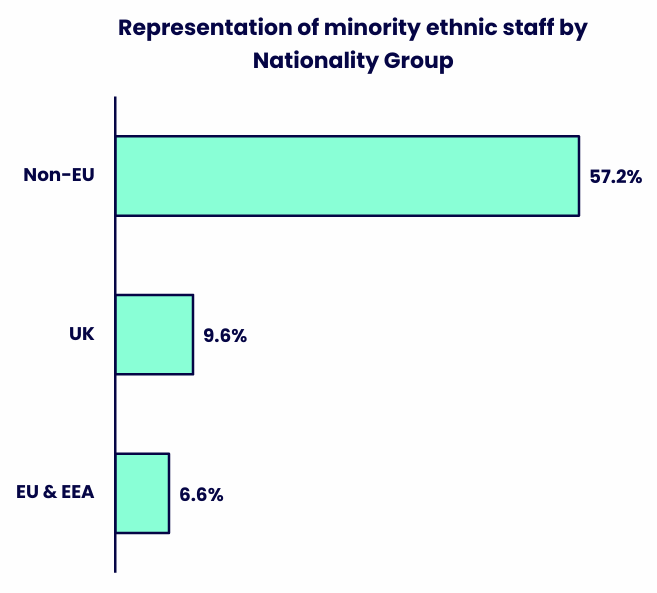
| Nationality group | & minority ethnic staff |
|---|---|
| Non-EU | 57.2% |
| UK | 9.6% |
| EU & EEA | 6.6% |
Most minority ethnic staff are from non-EU countries.
Ethnicity Subgroup = e.g. Asian, Black, Mixed, Other and White
Snapshot date(s): 2021/22 (as at 31stJuly 2022)
Scope: All Staff –Academic Staff (Central, Regional, Researcher & ALs) and Professional & Support Staff –data does not includeOU subsidiaries (OUSA, OUW, Mulberry Bear) or agency/temp workers.
Ethnicity subgroup and ethnicity subgroup by Sex
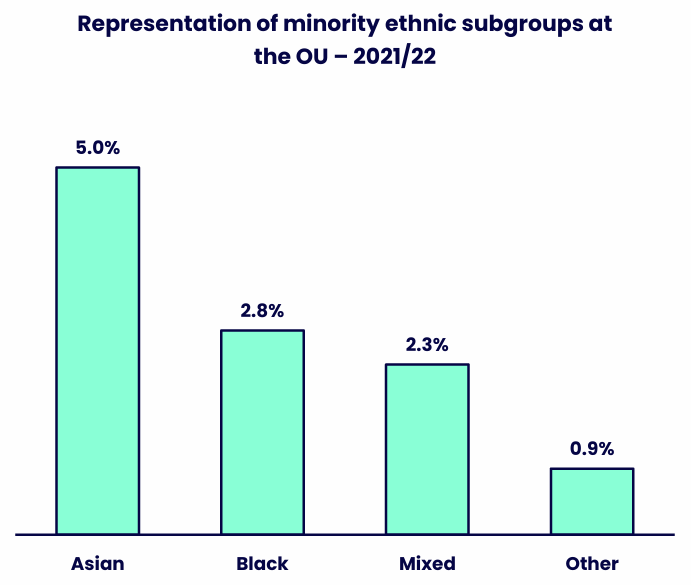
| Minority Ethnic Subgroup | % |
|---|---|
| Asian | 5.0% |
| Black | 2.8% |
| Mixed | 2.3% |
| Other | 0.9% |
Asian staff are the largest represented minority ethnic subgroup.
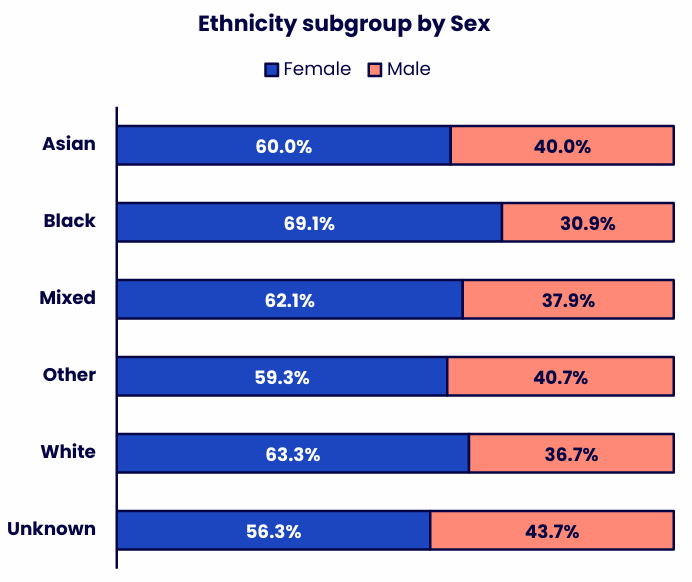
| Ethnicity subgroup | % Woman | % Man |
|---|---|---|
| Asian | 60.0% | 40.0% |
| Black | 69.1% | 30.9% |
| Mixed | 62.1% | 37.9% |
| Other | 59.3% | 40.7% |
| White | 63.3% | 36.7% |
| Unknown | 56.3% | 43.7% |
Women form the majority within every ethnicity subgroup, although the balance between women and men varies across the different groups.
Snapshot date(s): 2021/22 (as at 31stJuly 2022)
Scope: All Staff –Academic Staff (Central, Regional, Researcher & ALs) and Professional & Support Staff –data does not includeOU subsidiaries (OUSA, OUW, Mulberry Bear) or agency/temp workers.
Black, Asian and minority ethnic staff at the senior level
As at 31st July 2022, Black, Asian and minority ethnic staff represented 11.1% (32 out of 288) of the senior staff population, a 2.6 percentage point increase from 2017/18. The minority ethnic population is underrepresented within the SS bands (6.2%, 8 out of 130) and accounts for 15.2% of Professor grades. Black and mixed staff are the most underrepresented minority ethnic group at senior level. Three out of four minority ethnic groups are below the Equality Scheme target.
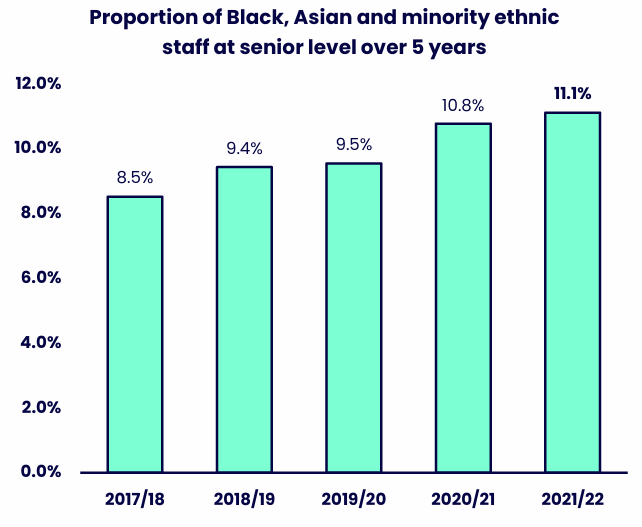
| Year | % Black, Asian and minority ethnic staff |
|---|---|
| 2018/19 | 8.5% |
| 2018/19 | 9.4% |
| 2019/20 | 9.5% |
| 2020/21 | 10.8% |
| 2021/22 | 11.1% |
Representation increased throughout the period, reaching its highest level in the most recent academic year.
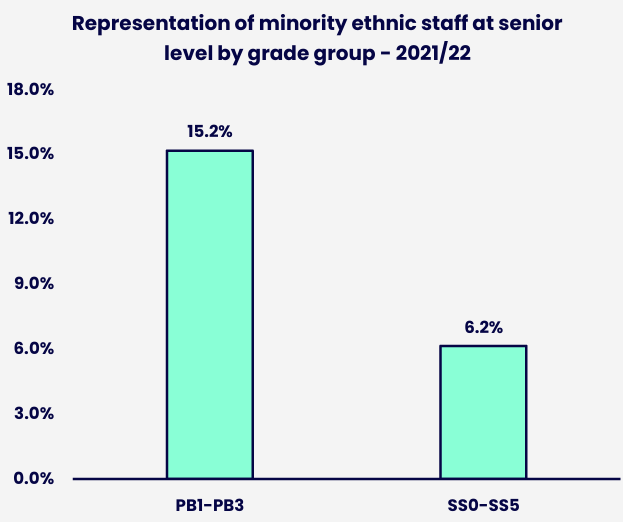
| Grade group | % Black, Asian and minority ethnic staff |
|---|---|
| PB1-PB3 | 15.2% |
| SS0-SS5 | 6.2% |
Representation of minority ethnic staff is higher in the PB1-PB3 grade group than in the SS0-SS5 grade group.
Snapshot date(s): 2017/18 to 2021/22 as at 31st July of each year (above chart) | 2021/22 (as at 31st July 2022; below chart)
Scope: Staff with ‘SS’ (Senior Staff) grades or ‘PB’ (Professor) grades
Ethnicity subgroup at senior level (equity target)
As at 31st July 2022, Black, Asian and minority ethnic staff represented 11.1% (32 out of 288) of the senior staff population, a 2.6 percentage point increase from 2017/18. The minority ethnic population is underrepresented within the SS bands (6.2%, 8 out of 130) and accounts for 15.2% of Professor grades. Black and mixed staff are the most underrepresented minority ethnic group at senior level. Three out of four minority ethnic groups are below the Equality Scheme target.
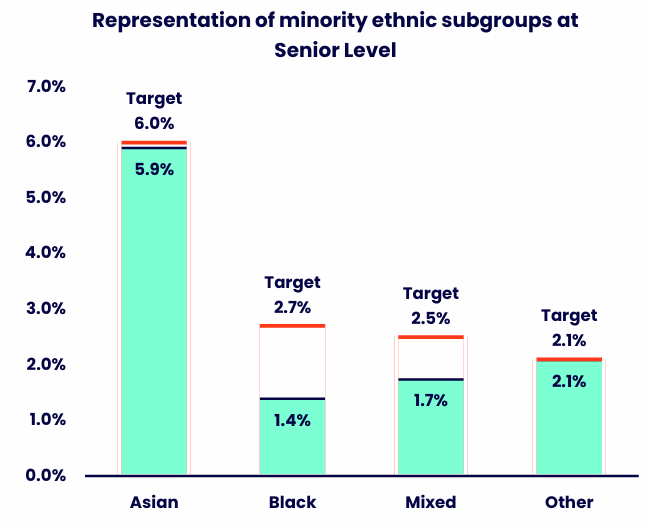
| Ethnicity subgroup | % Representation | % Target |
|---|---|---|
| Asian | 5.9% | 6.0% |
| Black | 1.4% | 2.7% |
| Mixed | 1.7% | 2.5% |
| Other | 2.1% | 2.1% |
Representation varies across minority ethnic subgroups at senior level, with the Asian and Other subgroups meeting or exceeding their targets, while the Black and Mixed subgroups remain below their target levels.
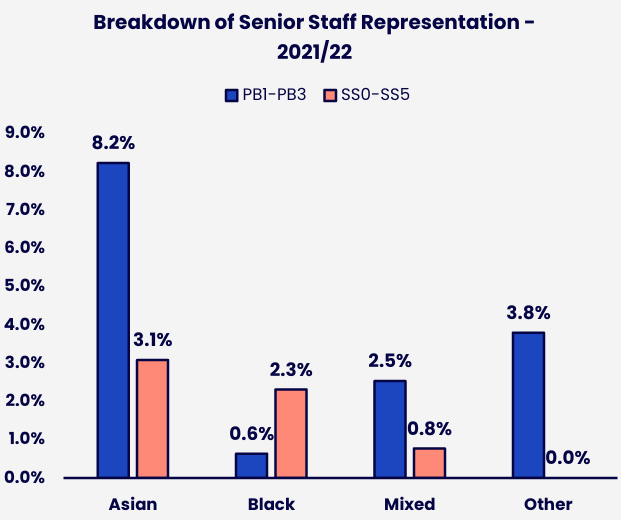
| Ethnicity subgroup | % PB1-PB3 | % SS0-SS5 |
|---|---|---|
| Asian | 8.2% | 3.1% |
| Black | 0.6% | 2.3% |
| Mixed | 2.5% | 0.8% |
| Other | 3.8% | 0.0% |
Representation varies by ethnicity subgroup and senior grade group.
Snapshot date(s): 2021/22 (as at 31st July 2022)
Scope: Staff with ‘SS’ (Senior Staff) or ‘PB’ (Professor) grades –data does not include OU Partner Organisations (OUSA, OUW), research students or contingent workers
Contact us
Equality, Diversity and Inclusion
The Open University
Walton Hall
Milton Keynes
MK7 6AA
Email [email protected]


Explore

Undergraduate
Postgraduate
Policy
-
Follow us on Social media
-


