
Recruitment - Staff Monitoring Report 2021/22
Recruitment data pipeline by protected characteristics
Age -Recruitment
The majority of applicants (63%) in 2021/22 are 45 and under; the average age of the candidate pool is 38.2 years old. The 56-65 age group is the most likely to be shortlisted while 25 and under are more likely to be appointed after interview. There were less than 70 applicants aged 66 and over in 2021/22.
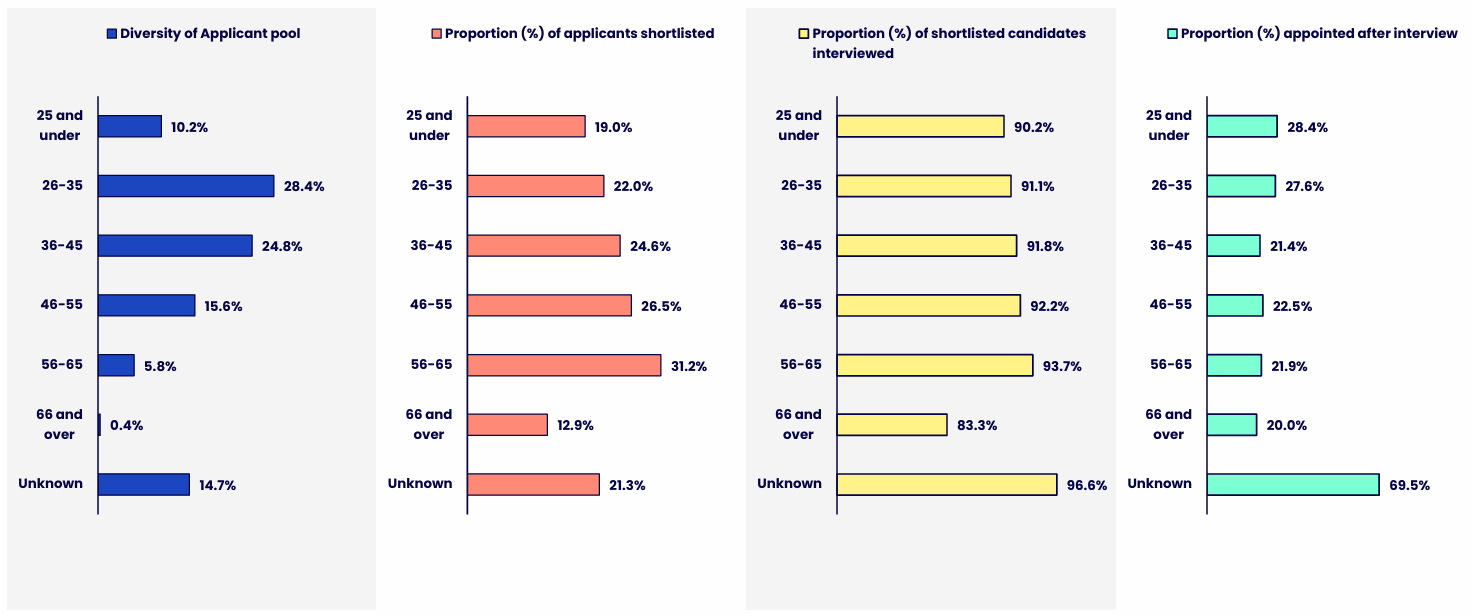
Age Group | Diversity of Applicant pool | Proportion (%) of applicants shortlisted | Proportion (%) of shortlisted candidates interviewed | Proportion (%) appointed after interview |
|---|---|---|---|---|
25 and under | 10.2% | 19.0% | 90.2% | 28.4% |
26-35 | 28.4% | 22.0% | 91.1% | 27.6% |
36-45 | 24.8% | 24.6% | 91.8% | 21.4% |
46-55 | 15.6% | 26.5% | 92.2% | 22.5% |
56-65 | 5.8% | 31.2% | 93.7% | 21.9% |
66 and over | 0.4% | 12.9% | 83.3% | 20.0% |
Unknown | 14.7% | 21.3% | 96.6% | 69.5% |
Reporting period : 2021/22 –1st August 2021 to 31st July 2022
Disability -Recruitment
In 2021/22, 6.9% of all applicants declared a disability. More than a quarter (27.8%) of applicants with a declared disability are shortlisted for an interview. One in 5 (21.8%) applicants with disabilities are appointed after an interview, compared to 1 in 4 (24.6%) of candidates with no disability.
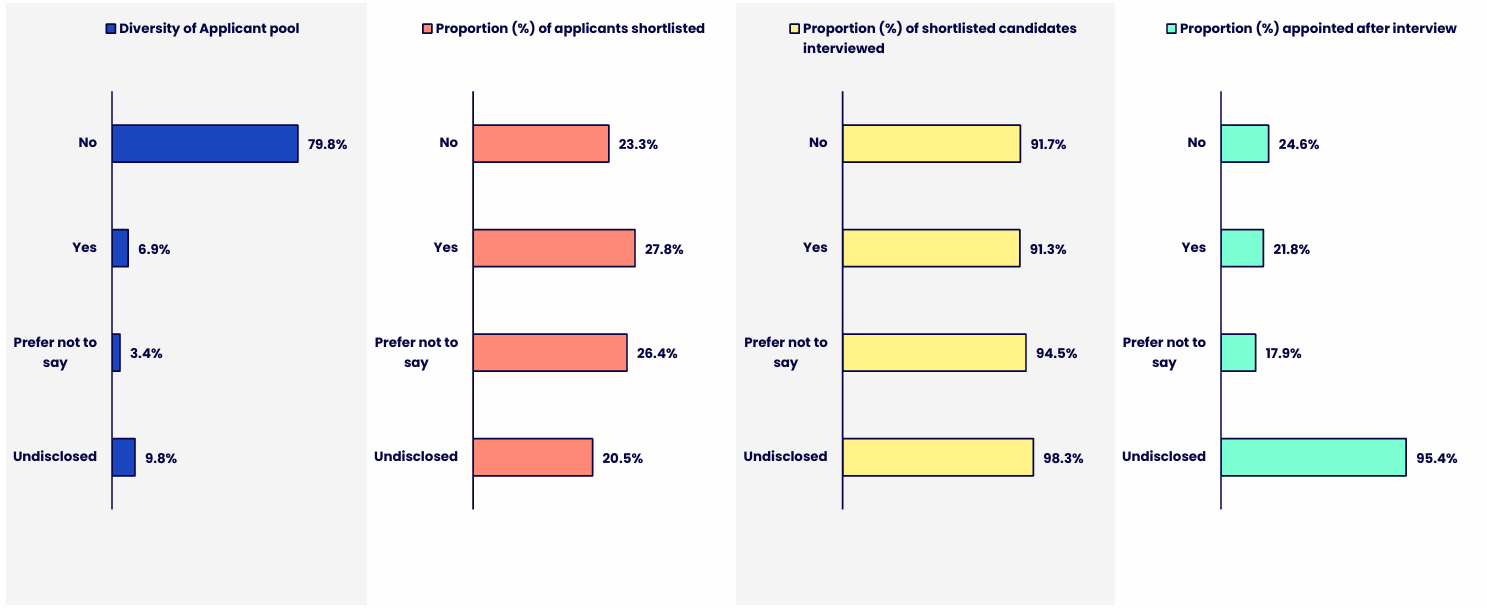
Disability status | Diversity of Applicant pool | Proportion (%) of applicants shortlisted | Proportion (%) of shortlisted candidates interviewed | Proportion (%) appointed after interview |
|---|---|---|---|---|
| No | 79.8% | 23.3% | 91.7% | 24.6% |
| Yes | 6.9% | 27.8% | 91.3% | 21.8% |
| Prefer not to say | 3.4% | 26.4% | 94.5% | 17.9% |
| Undisclosed | 9.8% | 20.5% | 98.3% | 95.4% |
Reporting period : 2021/22 –1st August 2021 to 31st July 2022
Ethnicity -Recruitment
A quarter (25.8%) of the applicant pool are candidates from Black, Asian and minority ethnic backgrounds, led largely by Asian ethnicities (12.5%). Candidates from Other ethnicities are the least likely to be shortlisted (16.7%) followed by Asian ethnicity groups (17.0%). Black candidates are the least likely to be appointed after interview (17.2%).
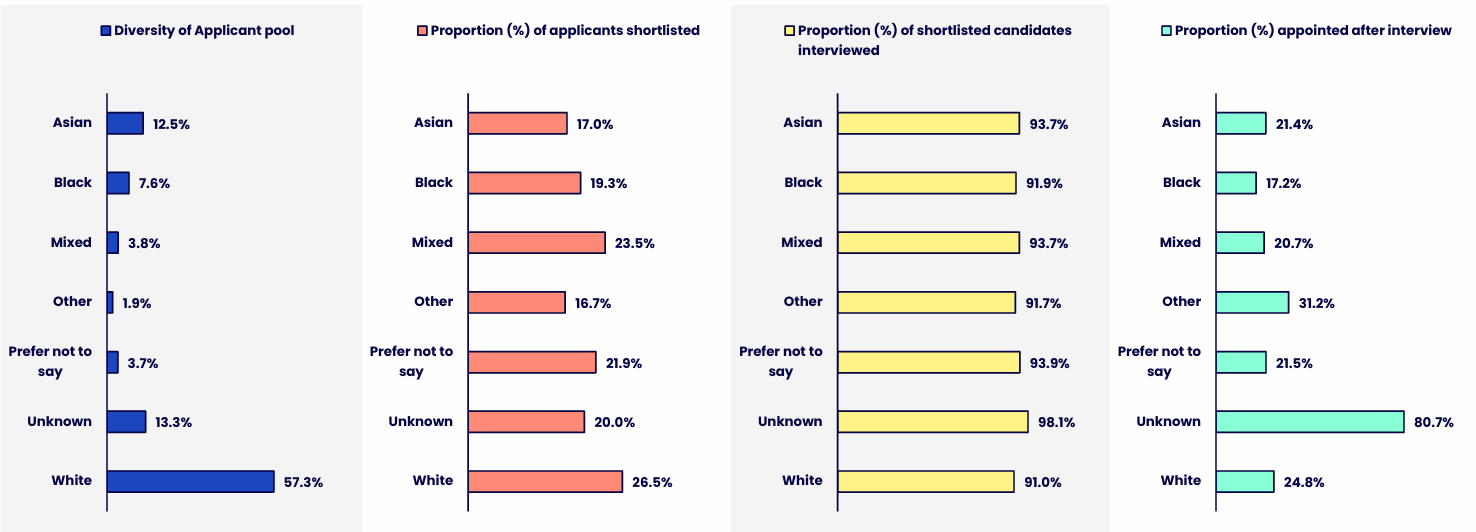
Ethnicity | Diversity of Applicant pool | Proportion (%) of applicants shortlisted | Proportion (%) of shortlisted candidates interviewed | Proportion (%) appointed after interview |
|---|---|---|---|---|
| Asian | 12.5% | 17.0% | 93.7% | 21.4% |
| Black | 7.6% | 19.3% | 91.9% | 17.2% |
| Mixed | 3.8% | 23.5% | 93.7% | 20.7% |
| Other | 1.9% | 16.7% | 91.7% | 31.2% |
| Prefer not to say | 3.7% | 21.9% | 93.9% | 21.5% |
| Unknown | 13.3% | 20.0% | 98.1% | 80.7% |
| White | 57.3% | 26.5% | 91.0% | 24.8% |
Reporting period : 2021/22 –1st August 2021 to 31st July 2022
Nationality -Recruitment
The large majority of applicants (72.3%) are UK nationals, followed by non-EU (16.5%) and EU/EEA (11.1%) nationalities. EU/EEA nationals are more likely to be shortlisted compared to non-EU nationals; however, non-EU nationals are more likely to be appointed after interview compared to UK and EU/EEA.
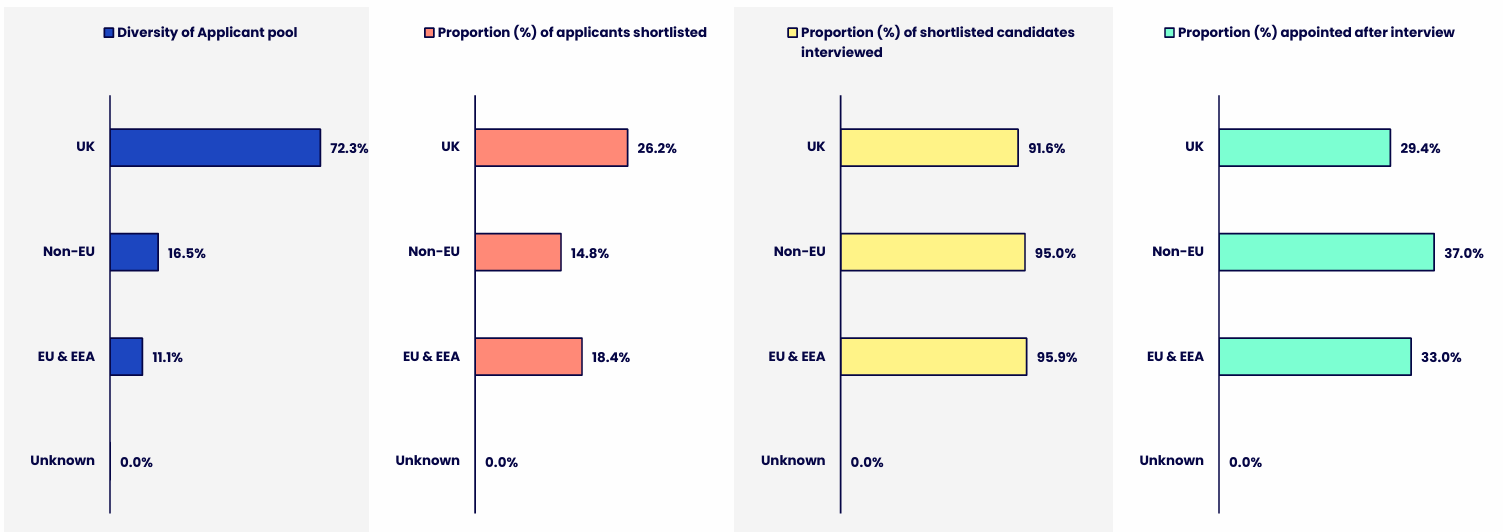
Nationality | Diversity of Applicant pool | Proportion (%) of applicants shortlisted | Proportion (%) of shortlisted candidates interviewed | Proportion (%) appointed after interview |
|---|---|---|---|---|
| UK | 72.3% | 26.2% | 91.6% | 29.4% |
| Non-EU | 16.5% | 14.8% | 95.0% | 37.0% |
| EU & EEA | 11.1% | 18.4% | 95.9% | 33.0% |
| Unknown | 0.0% | 0.0% | 0.0% | 0.0% |
Reporting period : 2021/22 –1st August 2021 to 31st July 2022
Gender -Recruitment
The majority (56.7%) of applicants are women who are also more likely to be shortlisted and appointed after interview compared to men. One in 10 (10.6%) have not revealed their gender identity. 69 applicants (0.3% of the total candidate pool) preferred to describe their gender identity in another way.
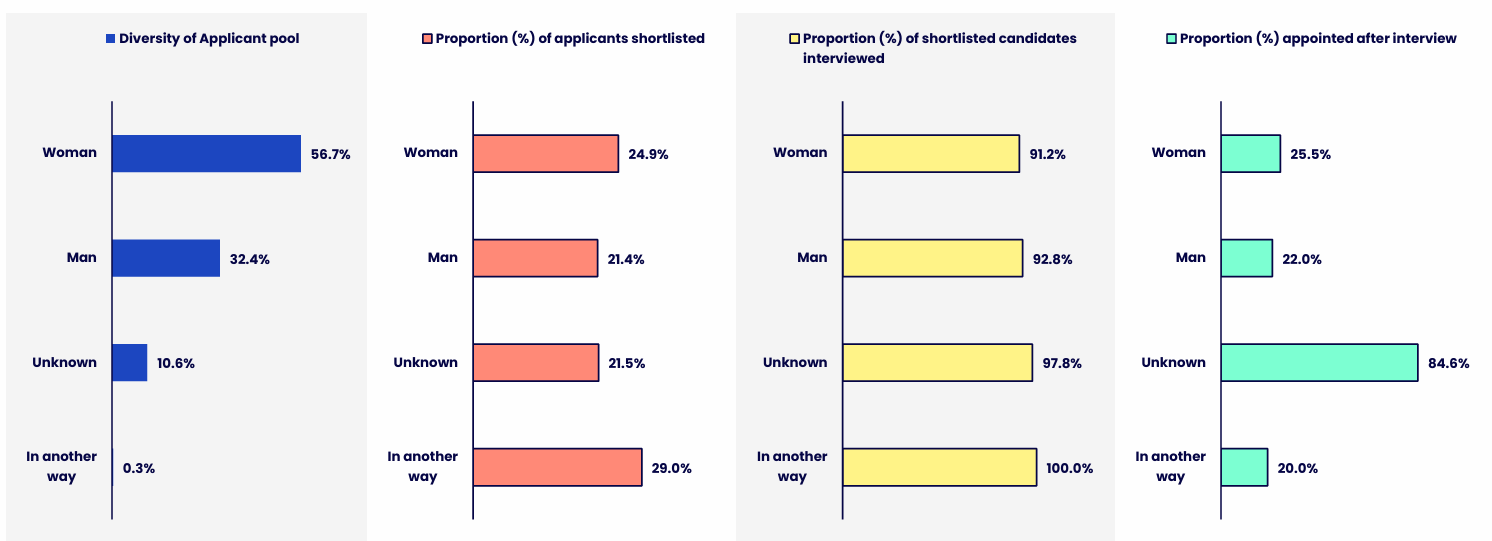
Gender | Diversity of Applicant pool | Proportion (%) of applicants shortlisted | Proportion (%) of shortlisted candidates interviewed | Proportion (%) appointed after interview |
|---|---|---|---|---|
| Woman | 56.7% | 24.9% | 91.2% | 25.5% |
| Man | 32.4% | 21.4% | 92.8% | 22.0% |
| Unknown | 10.6% | 21.5% | 97.8% | 84.6% |
| In another way | 0.3% | 29.0% | 100.0% | 20.0% |
Reporting period : 2021/22 –1st August 2021 to 31st July 2022
Religion -Recruitment
Two-fifths (40.5%) of applicants declared they had no religion or belief. Christianity was the second most common religion or belief group, representing over a quarter (26.7%) of all candidates. Despite representing the 3rd most common religion or belief group, Muslim candidates are the least likely to be shortlisted (14.6%) and interviewed. Fewer Jewish candidates are hired after interview compared to other religion or belief groups.
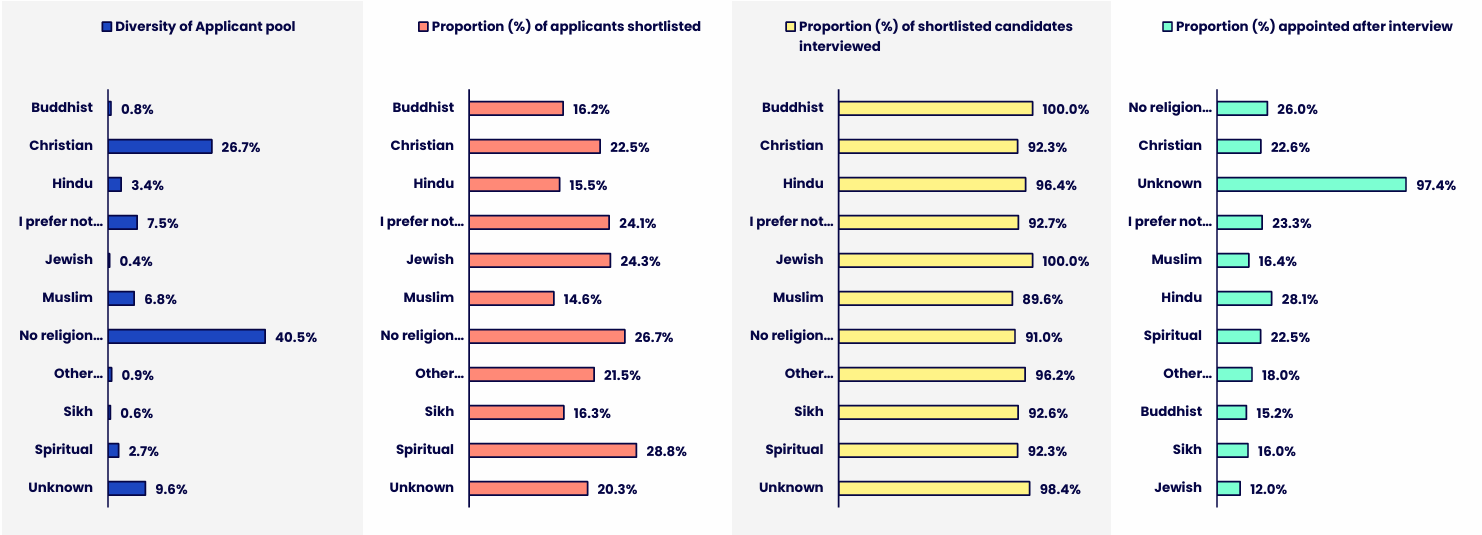
Religion | Diversity of Applicant pool | Proportion (%) of applicants shortlisted | Proportion (%) of shortlisted candidates interviewed | Proportion (%) appointed after interview |
|---|---|---|---|---|
| Buddhist | 0.8% | 16.2% | 100.0% | 26.0% |
| Christian | 26.7% | 22.5% | 92.3% | 22.6% |
| Hindu | 3.4% | 15.5% | 96.4% | 97.4% |
| I prefer not to say | 7.5% | 24.1% | 92.7% | 23.3% |
| Jewish | 0.4% | 24.3% | 100.0% | 16.4% |
| Muslim | 6.8% | 14.6% | 89.6% | 28.1% |
| No religion or belief | 40.5% | 26.7% | 91.0% | 22.5% |
| Other religion or belief | 0.9% | 21.5% | 96.2% | 18.0% |
| Sikh | 0.6% | 16.3% | 92.6% | 15.2% |
| Spiritual | 2.7% | 28.8% | 92.3% | 16.0% |
| Unknown | 9.6% | 20.3% | 98.4% | 12.0% |
Reporting period : 2021/22 –1st August 2021 to 31st July 2022
Sexual Orientation -Recruitment
One in 10 (9.3%) applicants identify as LGB+. Sexual orientation disclosure is the lowest compared to all other protected characteristics in recruitment, with 12.4% of candidates preferring not to say their sexual orientation. LGB+ candidates are slightly less likely to be shortlisted compared to heterosexual candidates but slightly more likely to be appointed after interview compared to heterosexual candidates.
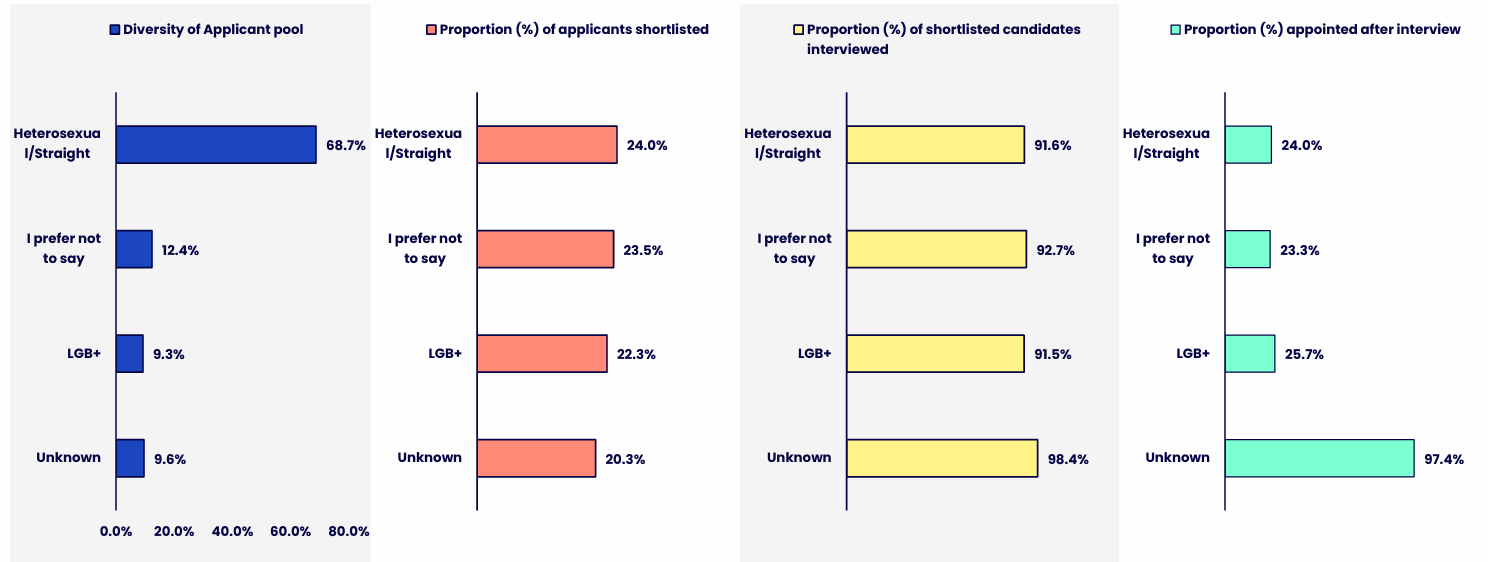
Sexual Orientation | Diversity of Applicant pool | Proportion (%) of applicants shortlisted | Proportion (%) of shortlisted candidates interviewed | Proportion (%) appointed after interview |
|---|---|---|---|---|
| Heterosexual/Straight | 68.7% | 24.0% | 91.6% | 24.0% |
| I prefer not to say | 12.4% | 23.5% | 92.7% | 23.3% |
| LGB+ | 9.3% | 22.3% | 91.5% | 25.7% |
| Unknown | 9.6% | 20.3% | 98.4% | 97.4% |
Reporting period : 2021/22 –1st August 2021 to 31st July 2022
Contact us
Equality, Diversity and Inclusion
The Open University
Walton Hall
Milton Keynes
MK7 6AA
Email [email protected]


Explore

Undergraduate
Postgraduate
Policy
-
Follow us on Social media
-


