
Religion - Staff Monitoring Report 2022/23
Religion 2022/23
Proportion % by religion or belief status in 2022/23
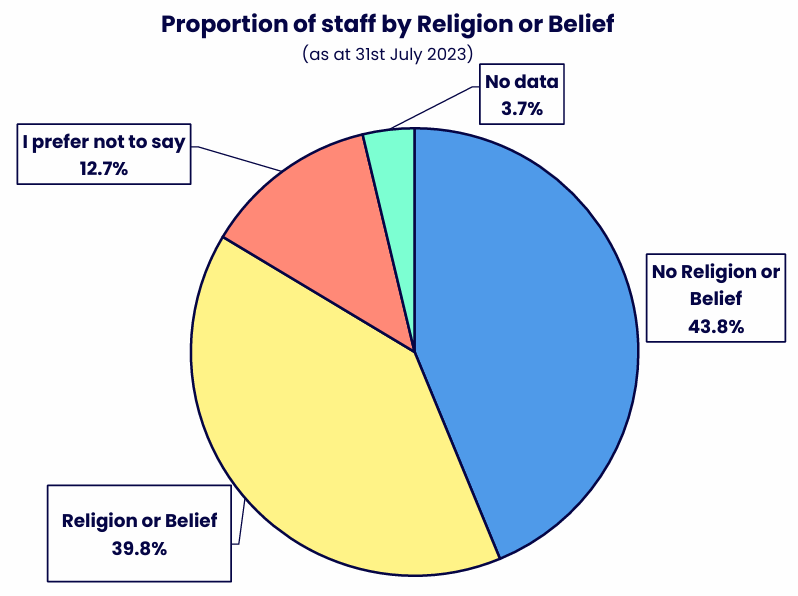
| Religion or Belief | % |
|---|---|
| No Religion or Belief | 43.8% |
| Religion or Belief | 39.8% |
| I prefer not to say | 12.7% |
| No data | 3.7% |
The largest group of staff report having no religion or belief.
Scope: All Staff (please see inclusion/exclusion table)
Snapshot date: 31st July 2023 (Academic Year 2022/23)
Religion or belief subgroup breakdown of current year (2022/23)
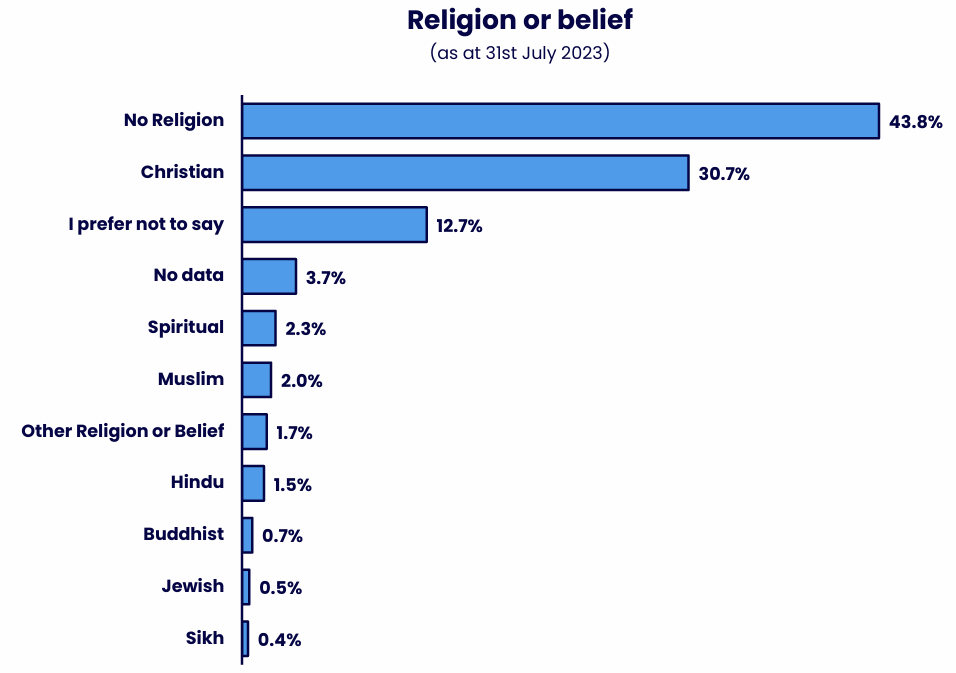
| Religion or Belief | % of OU staff |
|---|---|
| No Religion | 43.8% |
| Christian | 30.7% |
| I prefer not to say | 12.7% |
| No data | 3.7% |
| Spiritual | 2.3% |
| Muslim | 2.0% |
| Other Religion or Belief | 1.7% |
| Hindu | 1.5% |
| Buddhist | 0.7% |
| Jewish | 0.5% |
| Sikh | 0.4% |
No religion and Christianity are the largest religion or belief groups.
Snapshot date(s): 2022/23 (as at 31st July 2023)
Scope: All Staff – Academic Staff (Central, Regional, Researcher & ALs) and Professional & Support Staff – data does not include OU subsidiaries (OUSA, OUW, Mulberry Bear) or agency/temp workers
Religion by Employee Group
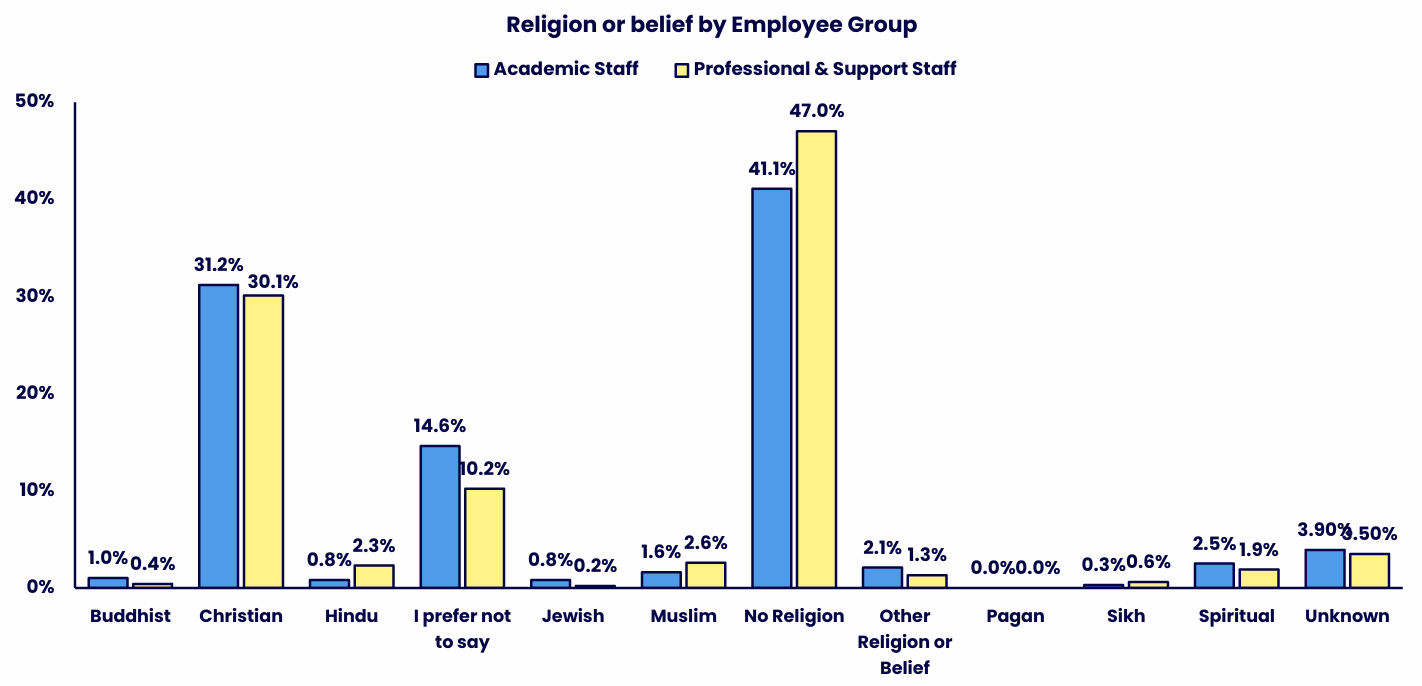
| Religion or Belief | Academic Staff | Professional & Support Staff |
|---|---|---|
| Buddhist | 1.0% | 0.4% |
| Christian | 31.2% | 30.1% |
| Hindu | 0.8% | 2.3% |
| I prefer not to say | 14.6% | 10.2% |
| Jewish | 0.8% | 0.2% |
| Muslim | 1.6% | 2.6% |
| No Religion | 41.1% | 47.0% |
| Other Religion or Belief | 2.1% | 1.3% |
| Pagan | 0.0% | 0.0% |
| Sikh | 0.3% | 0.6% |
| Spiritual | 2.5% | 1.9% |
| Unknown | 3.90% | 3.50% |
Both employee groups show similar religion and belief profiles, with Christianity and No Religion being the most common categories.
Snapshot date(s): 2022/23 (as at 31st July 2023)
Scope: All Staff – Academic Staff (Central, Regional, Researcher & ALs) and Professional & Support Staff – data does not include OU subsidiaries (OUSA, OUW, Mulberry Bear) or agency/temp workers.
Contact us
Equality, Diversity and Inclusion
The Open University
Walton Hall
Milton Keynes
MK7 6AA
Email [email protected]


Explore

Undergraduate
Postgraduate
Policy
-
Follow us on Social media
-


