
Disability - Staff Monitoring Report 2022/23
Disability 2022/23
Proportion % by Disability Declaration in 2022/23
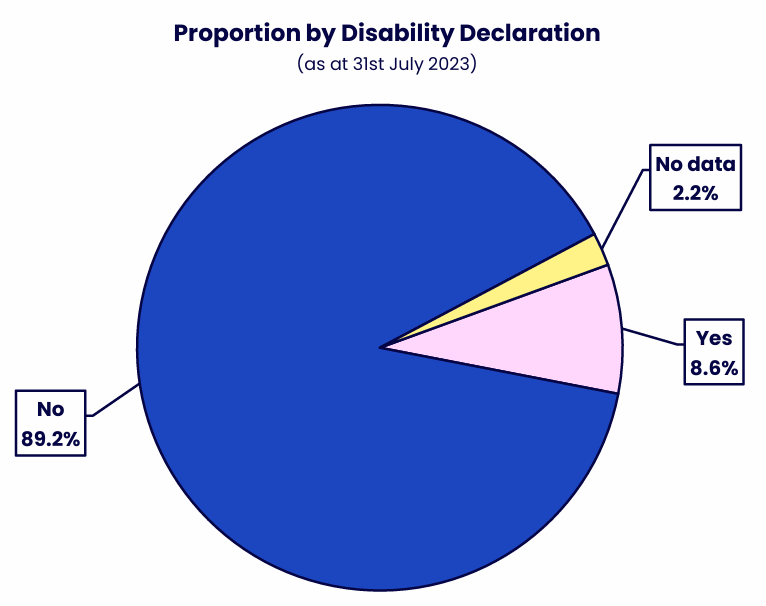
| Disability declaration | % |
|---|---|
| Yes | 8.6% |
| No | 89.2% |
| No data | 2.2% |
Most staff reported that they did not have a disability.
Scope: All Staff (please see inclusion/exclusion table)
Snapshot date: 31st July 2023 (Academic Year 2022/23)
Population and Disclosure Rate over 5 years
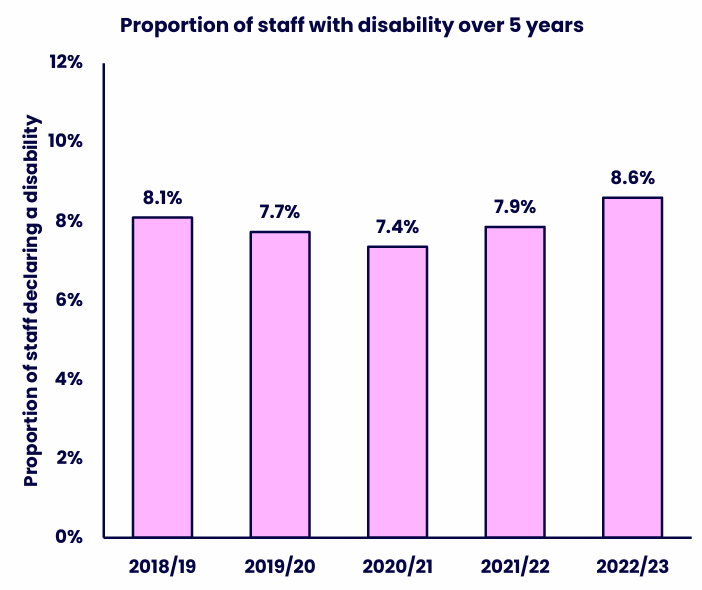
| Year | % Staff with disability |
|---|---|
| 2018/19 | 8.1% |
| 2019/20 | 7.7% |
| 2020/21 | 7.4% |
| 2021/22 | 7.9% |
| 2022/23 | 8.6% |
Disability declaration decreased in the earlier years shown before rising again.
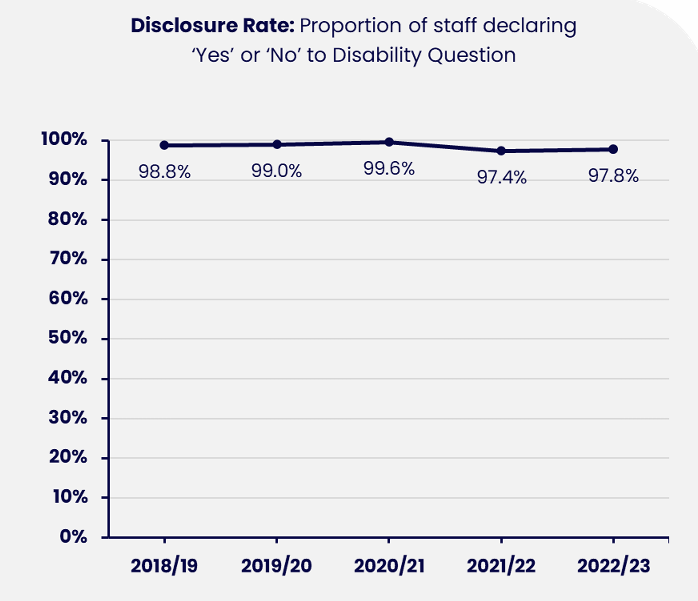
| Year | % Disclosure rate |
|---|---|
| 2018/19 | 98.8% |
| 2019/20 | 99.0% |
| 2020/21 | 99.6% |
| 2021/22 | 97.4% |
| 2022/23 | 97.8% |
The disability disclosure rate remained consistently high.
Snapshot date(s): 2018/19 to 2022/23 as at 31st July of each year.
Scope: All Staff – Academic Staff (Central, Regional, Researcher & ALs) and Professional & Support Staff – data does not include OU subsidiaries (OUSA, OUW, Mulberry Bear) or agency/temp workers.
Disability by Employee Group
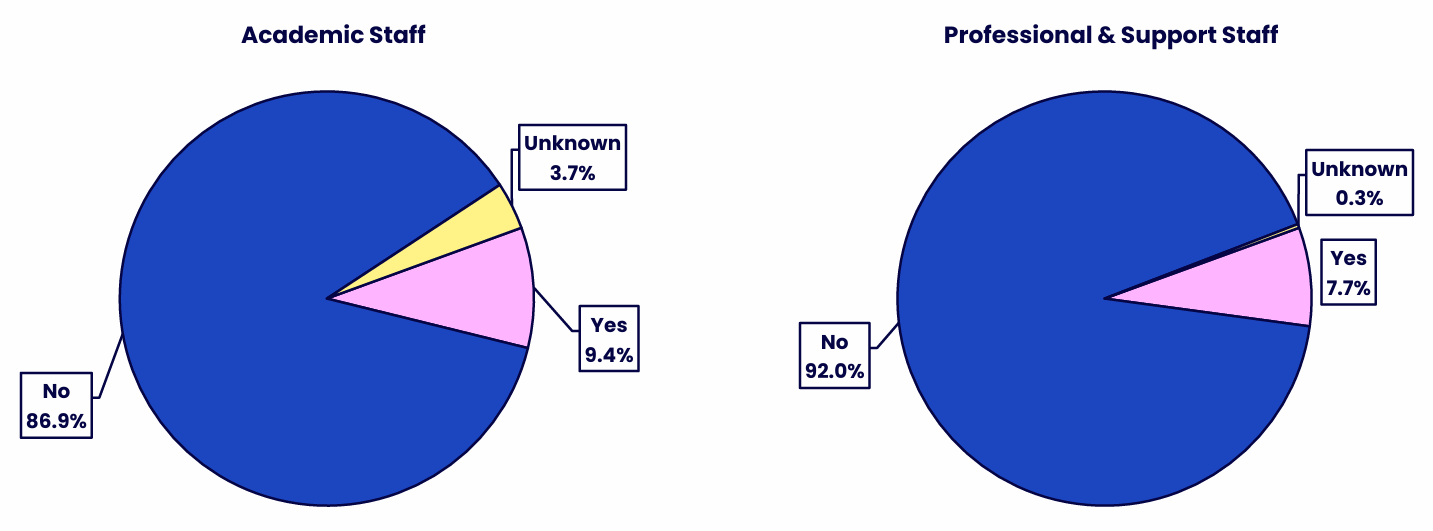
| Disability | Academic Staff | Professional & Support Staff |
|---|---|---|
| Yes | 9.4% | 7.7% |
| No | 86.9% | 92.0% |
| Unknown | 3.7% | 0.3% |
Academic Staff have a higher proportion of staff declaring a disability than Professional & Support Staff.
Snapshot date(s): 2022/23 (as at 31st July 2023)
Scope: All Staff – Academic Staff (Central, Regional, Researcher & ALs) and Professional & Support Staff – data does not include OU subsidiaries (OUSA, OUW, Mulberry Bear) or agency/temp workers.
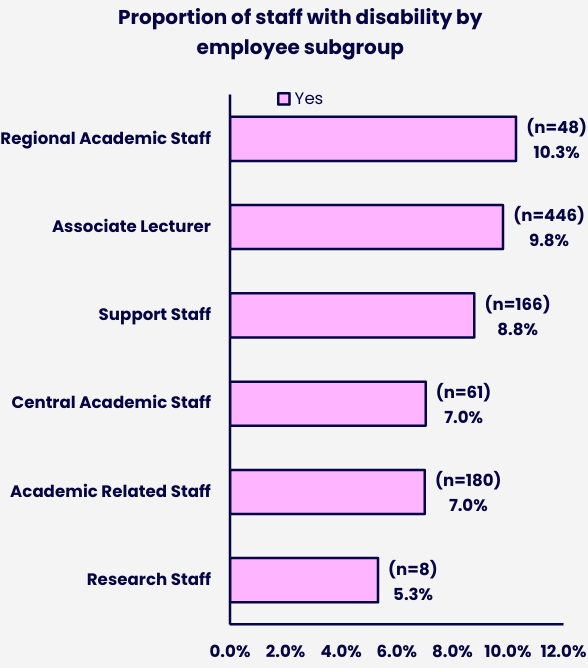
Disability by Employee Subgroup
| Employee Subgroup | % staff with disability |
|---|---|
| Regional Academic Staff | 10.3% (n=48) |
| Associate Lecturer | 9.8% (n=446) |
| Support Staff | 8.8% (n=166) |
| Central Academic Staff | 7.0% (n=61) |
| Academic Related Staff | 7.0% (n=180) |
| Research Staff | 5.3% (n=8) |
Disability declaration varies across employee subgroups, with Regional Academic Staff and Associate Lecturers showing the highest levels of declaration and Research Staff showing the lowest.
Snapshot date(s): 2022/23 (as at 31st July 2023)
Scope: All Staff – Academic Staff (Central, Regional, Researcher & ALs) and Professional & Support Staff – data does not include OU subsidiaries (OUSA, OUW, Mulberry Bear) or agency/temp workers.
Representation at senior level (Equality KPI targets)
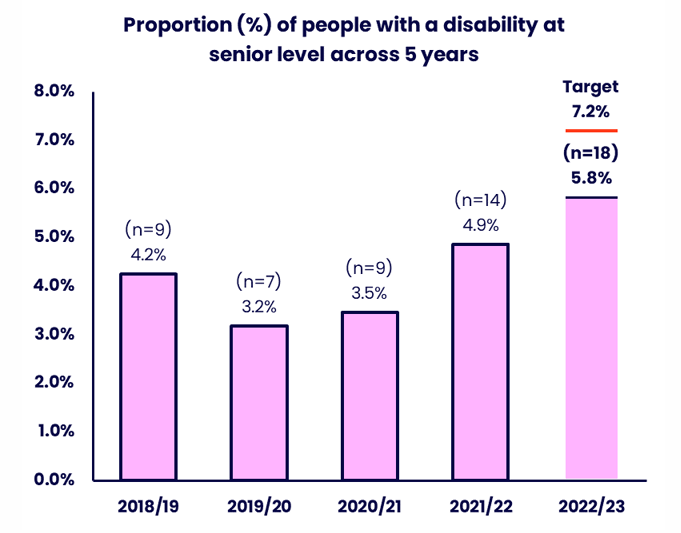
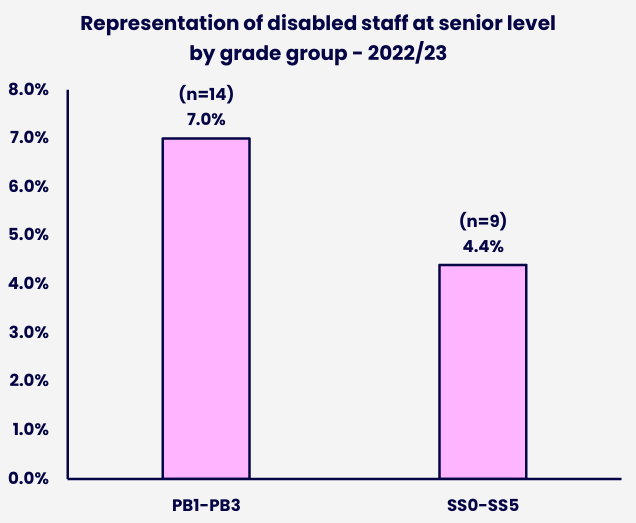
Due to more colleagues with declared disabilities entering PB1 grades, the representation of disabled colleagues at senior level is now at 5.8%, a 1 percentage point increase from the previous year (2021/22). There are more disabled colleagues in professor bands (7.0%) compared to SS grades (4.4%). Due to this increase in representation, we are now 1.4% below target compared to 2.3% below target in the previous year.
| Year | % Disclosure rate |
|---|---|
| 2018/19 | 4.2% (n=9) |
| 2019/20 | 3.2% (n=7) |
| 2020/21 | 3.5% (n=9) |
| 2021/22 | 4.9% (n=14) |
| 2022/23 | 5.8% (n=18) |
Disability representation at senior level has increased steadily since 2019/20, but remained below the 7.2% target in 2022/23.
| Grades | % Disclosure rate |
|---|---|
| PB1-PB3 | 7.0% (n=14) |
| SS0-SS5 | 4.4% (n=9) |
Disabled staff are more highly represented in the PB1–PB3 grade group than in SS0–SS5.
Snapshot date(s): 2018/19 to 2022/23 as at 31st July of each year (above chart) | below chart shows the current year 2022/23 (as at 31st July 2023) SS0-SS5
Scope: Staff with ‘SS’ (Senior Staff) grades or ‘PB’ (Professor) grades
Disability - Recruitment
In 2022/23, the proportion of applicants with a declared disability was 7.3%, a slight increase from previous year (6.9%). The proportion of disabled candidates increased at the shortlisting stage to 8.5%. However, fewer disabled candidates were successful after interview, making up 5.3% of new appointments.
| Disability status | Number of applicants | % of all applicants | Number of Shortlisted Applicants | % of All Shortlisted Applicants | Number of Appointed Candidates | % of All Appointed Candidates | Proportion (%) of applicants shortlisted | Proportion (%) of shortlisted candidates interviewed | Proportion (%) appointed after interview |
|---|---|---|---|---|---|---|---|---|---|
| Disabled | 1,123 | 7.3% | 304 | 8.5% | 55 | 5.3% | 27.1% | 80.6% | 22.4% |
| Non-disabled | 12,471 | 80.9% | 2,707 | 76.1% | 550 | 53.2% | 21.7% | 78.9% | 25.7% |
| Prefer not to say | 969 | 6.3% | 262 | 7.4% | 144 | 13.9% | 27.0% | 77.1% | 71.3% |
| No data / Undisclosed | 847 | 5.5% | 285 | 8.0% | 285 | 27.6% | 33.6% | 100.0% | 100.0% |
| Grand Total | 15,410 | 100.0% | 3,558 | 100.0% | 1,034 | 100.0% | 23.1% | 80.6% | 36.0% |
Reporting period : 1st August 2022 to 31st July 2023
Scope: All Staff – Academic Staff (Central, Regional, Researcher & ALs) and Professional & Support Staff – data does not include OU subsidiaries (OUSA, OUW, Mulberry Bear) or agency/temp workers.
Contact us
Equality, Diversity and Inclusion
The Open University
Walton Hall
Milton Keynes
MK7 6AA
Email [email protected]


Explore

Undergraduate
Postgraduate
Policy
-
Follow us on Social media
-


