
Sex - Staff Monitoring Report 2023/24
Sex 2023/24
Proportion female and male in 2023/24
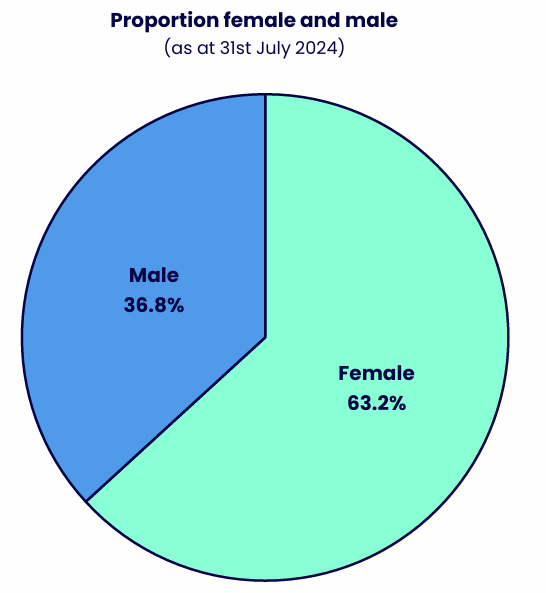
| Sex | % |
|---|---|
| Female | 63.2% |
| Male | 36.8% |
Female staff make up the majority of the workforce.
Scope: All Staff (please see inclusion/exclusion table)
Snapshot date: 31st July 2024 (Academic Year 2023/24)
Proportion female and male over the last five years
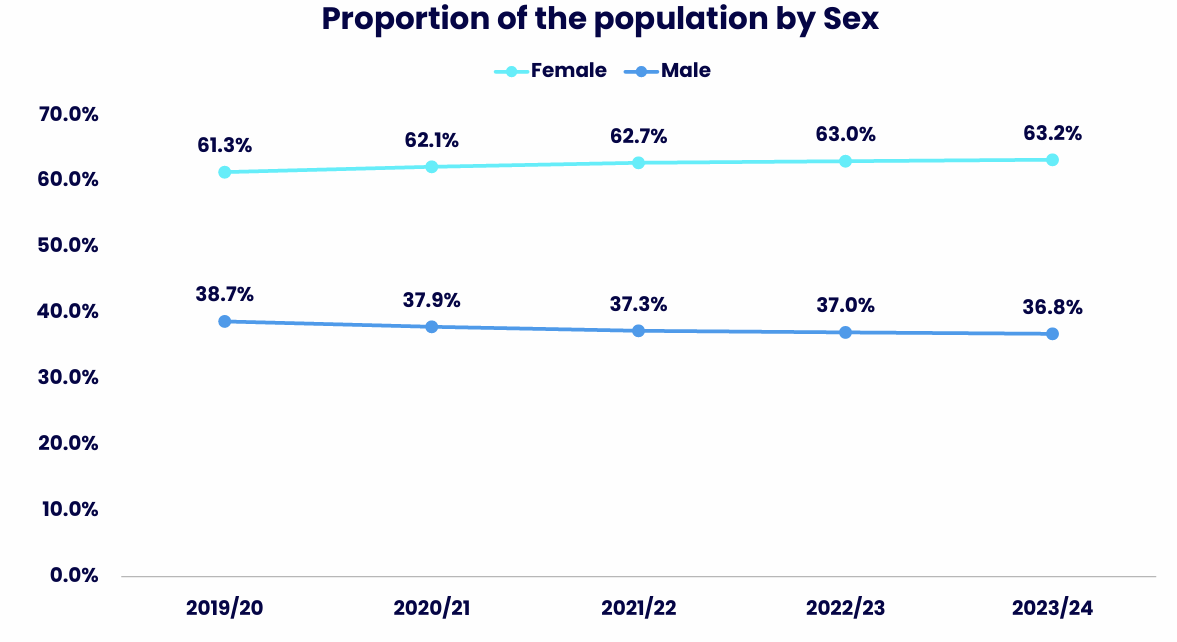
| Year | % Female | % Male |
|---|---|---|
| 2019/20 | 61.3% | 38.7% |
| 2020/21 | 62.1% | 37.9% |
| 2021/22 | 62.7% | 37.3% |
| 2022/23 | 63.0% | 37.0% |
| 2023/24 | 63.2% | 36.8% |
Snapshot date(s): 2019/20 to 2023/24 as at 31st July of each year.
Scope: All Staff – Academic Staff (Central, Regional, Research and ALs) and Professional and Support Staff – data does not include OU subsidiaries (OUSA, OUW, Mulberry Bear) or agency/temp workers.
Sex by Employee Group
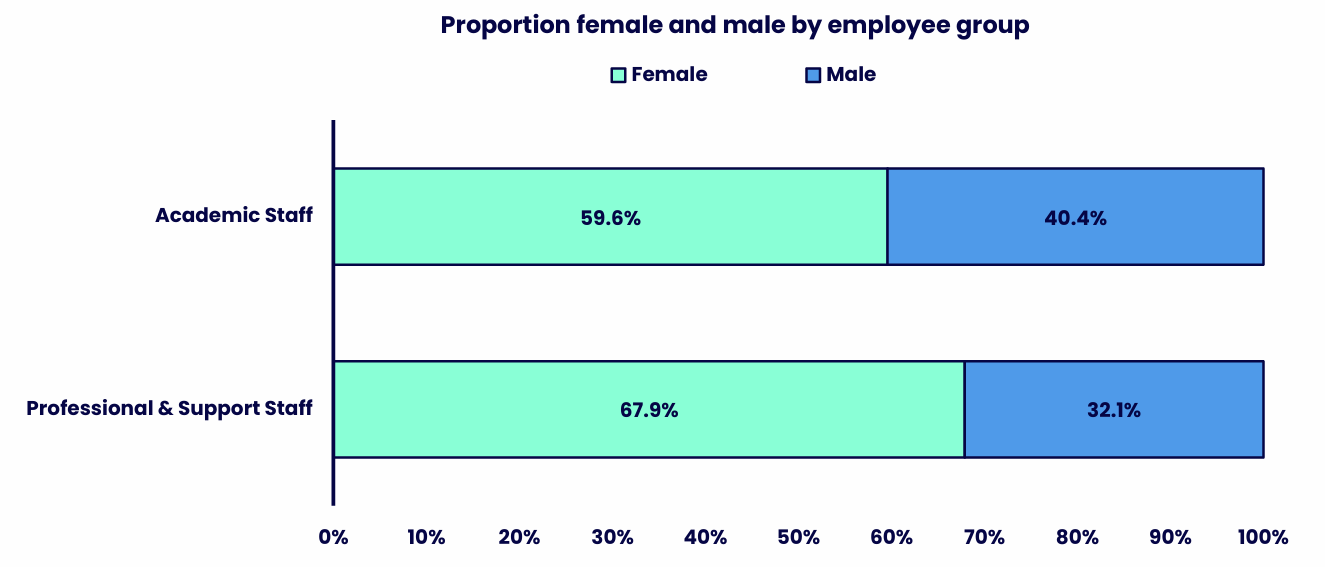
| Employee Group | % Female | % Male |
|---|---|---|
| Academic Staff | 59.6% | 40.4% |
| Professional & Support Staff | 67.9% | 32.1% |
Both employee groups are predominantly female.
Snapshot date(s): 2023/24 (as at 31st July 2024)
Scope: All Staff – Academic Staff (Central, Regional, Research and ALs) and Professional and Support Staff – data does not include OU subsidiaries (OUSA, OUW, Mulberry Bear) or agency/temp workers.
Sex by Employee Subgroup
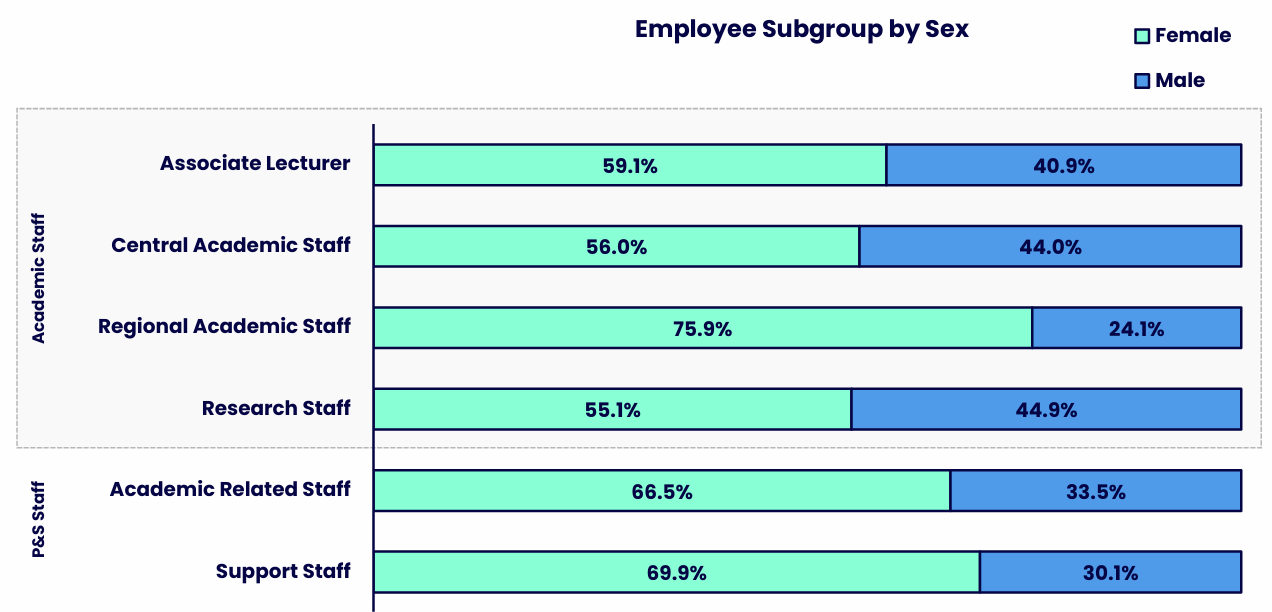
| Employee Subgroup | % Female | % Male |
|---|---|---|
| Associate Lecturer | 59.1% | 40.9% |
| Central Academic Staff | 56.0% | 44.0% |
| Regional Academic Staff | 75.9% | 24.1% |
| Research Staff | 55.1% | 44.9% |
| Academic Related Staff | 66.5% | 33.5% |
| Support Staff | 69.9% | 30.1% |
Females are the majority in every employee subgroup.
Snapshot date(s): 2023/24 (as at 31st July 2024)
Scope: All Staff – Academic Staff (Central, Regional, Research and ALs) and Professional and Support Staff – data does not include OU subsidiaries (OUSA, OUW, Mulberry Bear) or agency/temp workers
Female representation at senior level
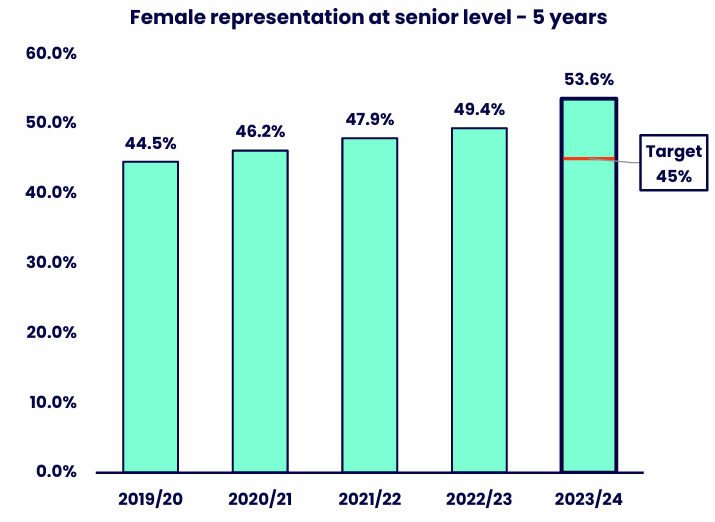
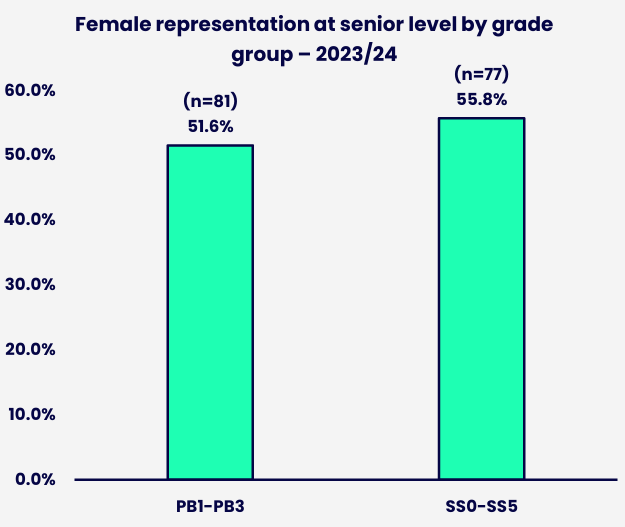
Female representation at senior level continues to increase, now making up over half (53.6%) of the senior level population. When looking at the split between the grade groups that make up the senior level (Professors/PB and Senior Staff/SS), there are more staff in PB grades compared to SS grades; however, there is higher female representation in SS grades. Over half of the SS grade population are female (55.8%, 77 out of 138).
| Year | % Female |
|---|---|
| 2019/20 | 44.5% |
| 2020/21 | 46.2% |
| 2021/22 | 47.9% |
| 2022/23 | 49.4% |
| 2023/24 | 53.6% |
Female representation at senior level increased steadily throughout the period and exceeded the target in the most recent year shown.
| Year | % Female |
|---|---|
| PB1-PB3 | 51.6% (n=81) |
| SS0-SS5 | 55.8% (n=77) |
Female representation is higher in the SS0-SS5 grade group than in the PB1-PB3 grade group.
Snapshot date(s): 2019/20 to 2023/24 as at 31st July of each year (above chart) | 2023/24 (as at 31st July 2024; below chart)
Scope: Staff with ‘SS’ (Senior Staff) grades or ‘PB’ (Professor) grades
Contact us
Equality, Diversity and Inclusion
The Open University
Walton Hall
Milton Keynes
MK7 6AA
Email [email protected]


Explore

Undergraduate
Postgraduate
Policy
-
Follow us on Social media
-


