
Ethnicity - Staff Monitoring Report 2023/24
Ethnicity 2023/24
Proportion % by Ethnicity Group in 2023/24
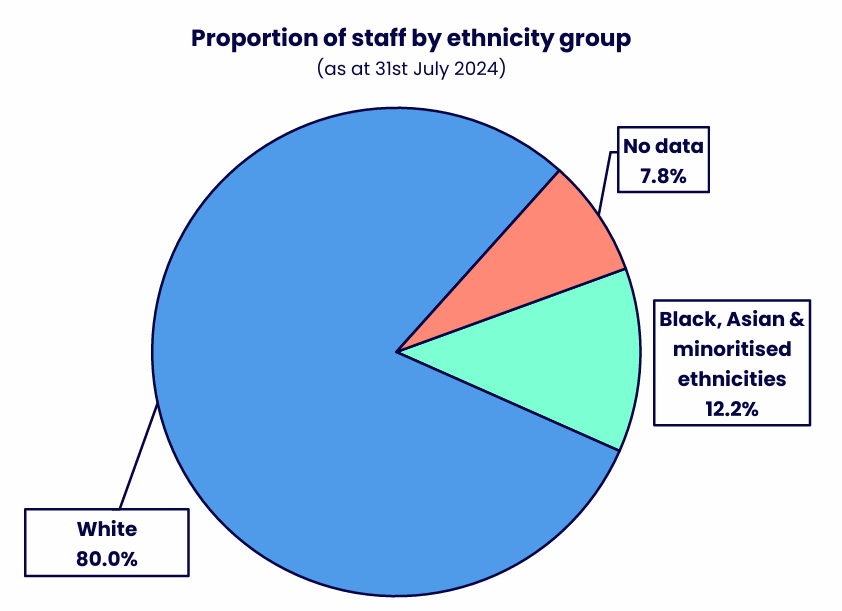
| Ethnicity group | % |
|---|---|
| Black, Asian & minoritised ethnicities | 12.2% |
| White | 80.0% |
| No data | 7.8% |
The majority of staff identify as White.
Ethnicity Group = e.g. Black, Asian and minoritised ethnicities
Scope: All Staff (please see inclusion/exclusion table)
Snapshot date: 31st July 2024 (Academic Year 2023/24)
Population and Disclosure Rate over 5 years
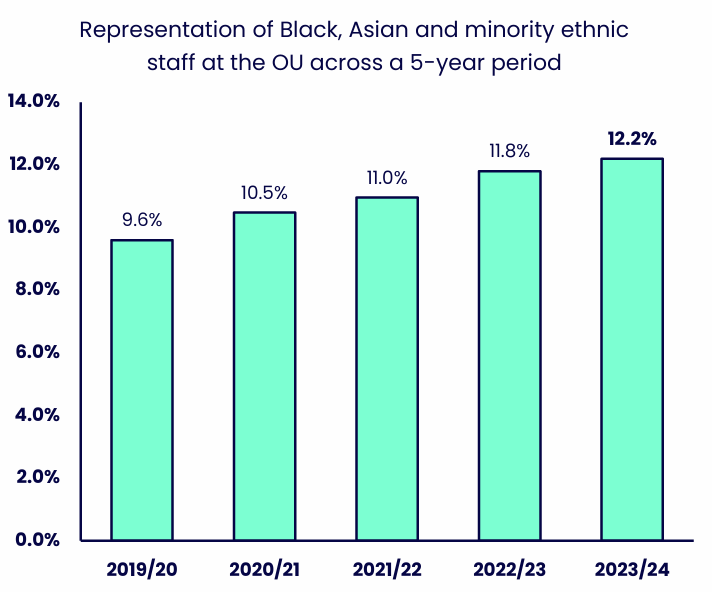
| Year | % Black, Asian and minority ethnic staff |
|---|---|
| 2019/20 | 9.6% |
| 2020/21 | 10.5% |
| 2021/22 | 11.0% |
| 2022/23 | 11.8% |
| 2023/24 | 12.2% |
Representation of Black, Asian and minority ethnic staff increased steadily over time.
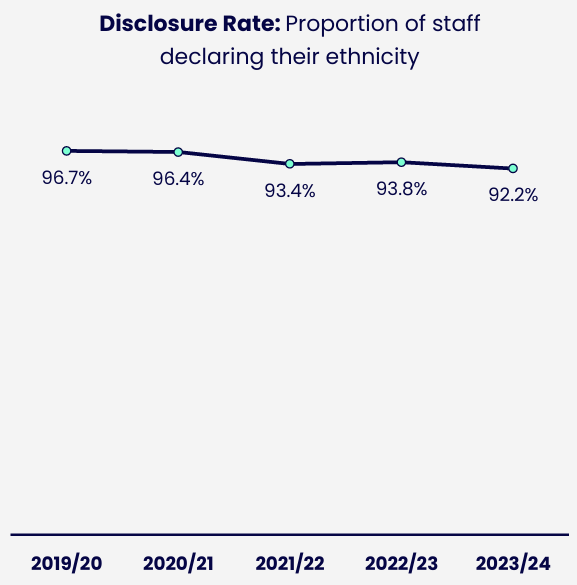
| Year | % disclosed ethnicity |
|---|---|
| 2019/20 | 96.7% |
| 2020/21 | 96.4% |
| 2021/22 | 93.4% |
| 2022/23 | 93.8% |
| 2023/24 | 92.2% |
Ethnicity disclosure rates remained consistently high throughout the period.
Snapshot date(s): 2019/20 to 2023/24 as at 31st July of each year.
Scope: All Staff – Academic Staff (Central, Regional, Research and ALs) and Professional and Support Staff – data does not include OU subsidiaries (OUSA, OUW, Mulberry Bear) or agency/temp workers.
Ethnicity subgroup and Nationality
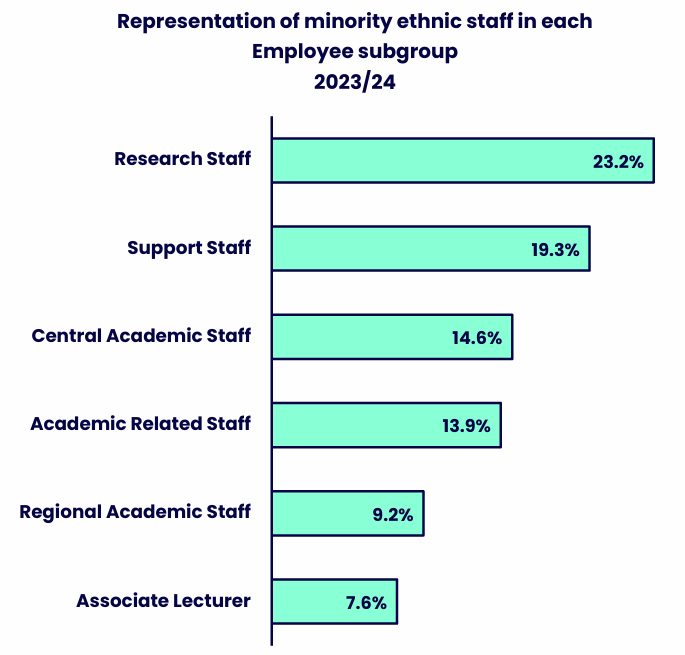
| Employee Subgroup | % Racially minoritised staff |
|---|---|
| Research Staff | 23.2% |
| Support Staff | 19.3% |
| Central Academic Staff | 14.6% |
| Academic Related Staff | 13.9% |
| Regional Academic Staff | 9.2% |
| Associate Lecturer | 7.6% |
Representation of minority ethnic staff varies across employee subgroups, with Research Staff and Support Staff showing the highest representation, while Associate Lecturers and Regional Academic Staff show the lowest representation.
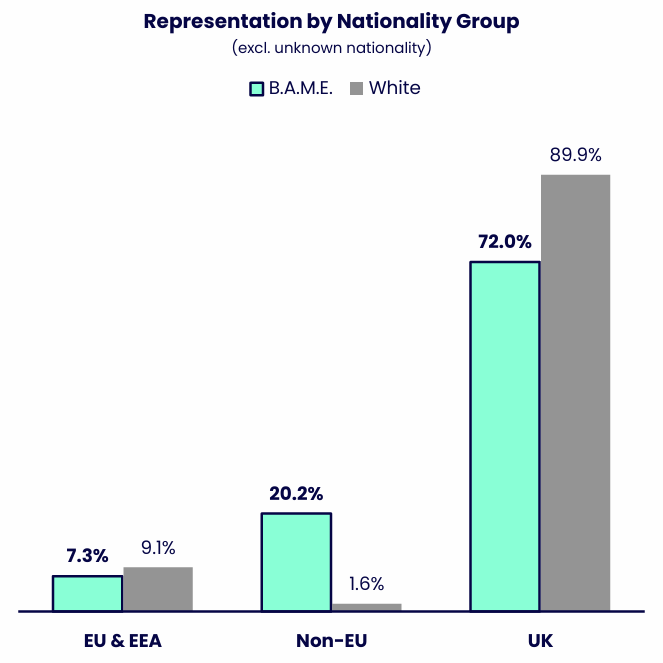
| Nationality group | B.A.M.E. | White |
|---|---|---|
| EU & EEA | 7.3% | 9.1% |
| Non-EU | 20.2% | 1.6% |
| UK | 72.0% | 89.9% |
Staff from Black, Asian and minoritised ethnic backgrounds have a more internationally diverse nationality profile, while White staff are more concentrated in the UK nationality group.
Ethnicity Subgroup = e.g. Asian, Black, Mixed, Other and White
Snapshot date(s): 2023/24 (as at 31st July 2024)
Scope: All Staff – Academic Staff (Central, Regional, Research and ALs) and Professional and Support Staff – data does not include OU subsidiaries (OUSA, OUW, Mulberry Bear) or agency/temp workers.
Ethnicity subgroup and ethnicity subgroup by Sex
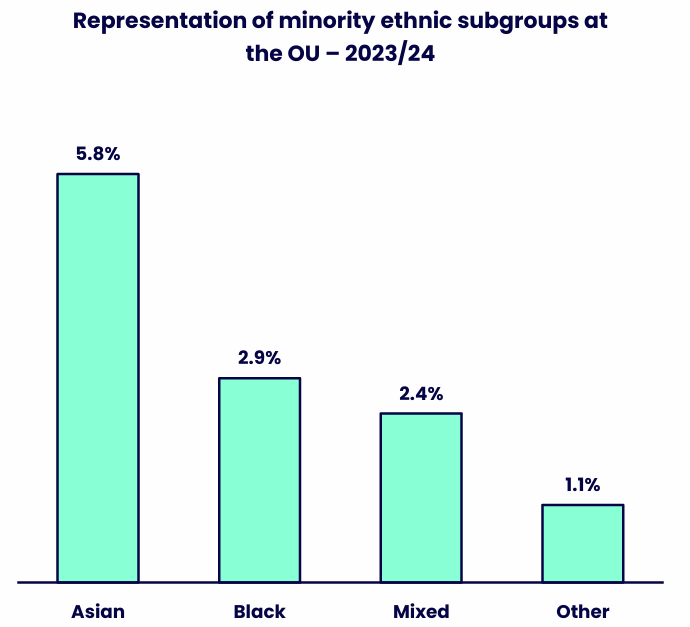
| Minority Ethnic Subgroup | % |
|---|---|
| Asian | 5.8% |
| Black | 2.9% |
| Mixed | 2.4% |
| Other | 1.1% |
Asian staff are the largest represented minority ethnic subgroup.
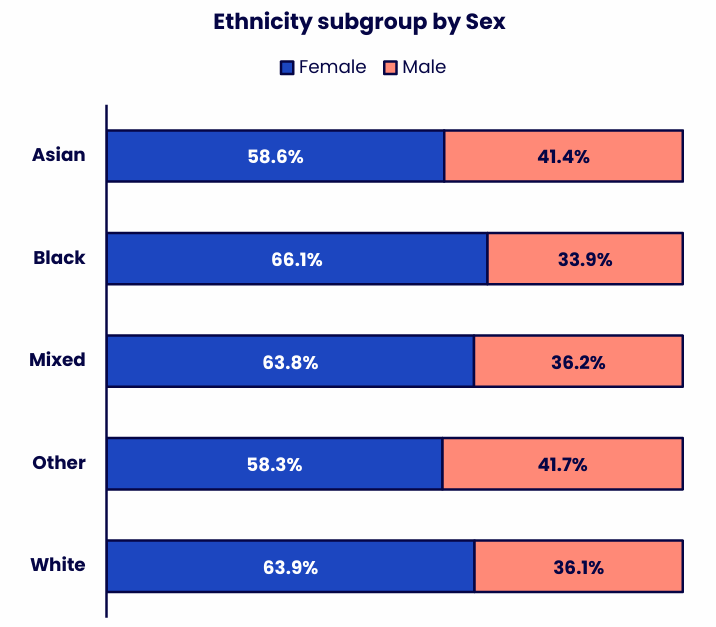
| Ethnicity subgroup | % Female | % Male |
|---|---|---|
| Asian | 58.6% | 41.4% |
| Black | 66.1% | 33.9% |
| Mixed | 63.8% | 36.2% |
| Other | 58.3% | 41.7% |
| White | 63.9% | 36.1% |
Females make up the majority within every ethnicity subgroup.
Snapshot date(s): 2023/24 (as at 31st July 2024)
Scope: All Staff – Academic Staff (Central, Regional, Research and ALs) and Professional and Support Staff – data does not include OU subsidiaries (OUSA, OUW, Mulberry Bear) or agency/temp workers.
Black, Asian and minority ethnic staff at the senior level
As at 31st July 2023, Black, Asian and minority ethnic staff represented 12.2% (36 out of 295) of the senior staff population, a 0.1 percentage point decrease from 2022/23. The minority ethnic population is underrepresented within the SS bands (8.7%, 12 out of 138) and account for 15.3% of professor grades. Black colleagues are least represented at senior level, accounting for 1.0% of the senior leadership population.
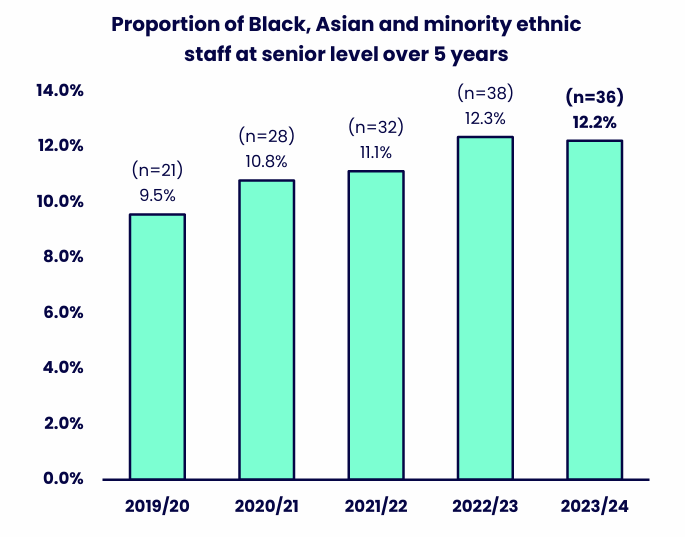
| Year | % Black, Asian and minority ethnic staff |
|---|---|
| 2019/20 | 9.5% (n=21) |
| 2020/21 | 10.8% (n=28) |
| 2021/22 | 11.1% (n=32) |
| 2022/23 | 12.3% (n=38) |
| 2023/24 | 12.2% (n=36) |
Representation of Black, Asian and minority ethnic staff at senior level increased over most of the period shown.
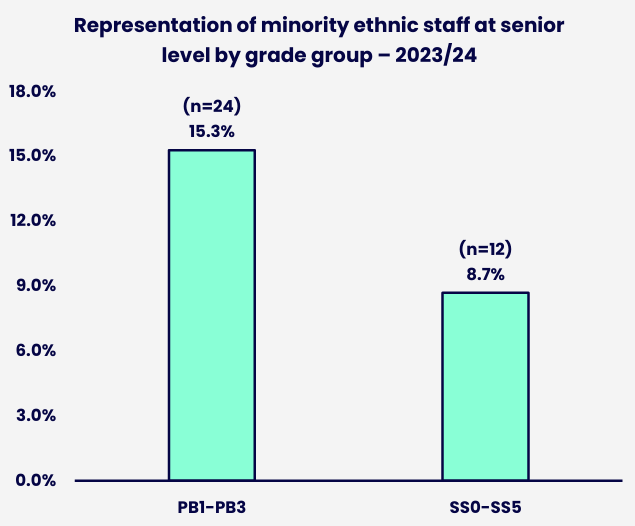
| Grade group | % Black, Asian and minority ethnic staff |
|---|---|
| PB1-PB3 | 15.3% (n=24) |
| SS0-SS5 | 8.7% (n=12) |
Representation of minority ethnic staff is higher in the PB1-PB3 grade group than in the SS0-SS5 grade group.
Snapshot date(s): 2019/20 to 2023/24 as at 31st July of each year (above chart) | below chart shows the current year 2023/24 (as at 31st July 2024)
Scope: Staff with ‘SS’ (Senior Staff) grades or ‘PB’ (Professor) grades
Ethnicity subgroup at senior level (equity target)
As at 31st July 2023, Black, Asian and minority ethnic staff represented 12.2% (36 out of 295) of the senior staff population, a 0.1 percentage point decrease from 2022/23. The minority ethnic population is underrepresented within the SS bands (8.7%, 12 out of 138) and account for 15.3% of professor grades. Black colleagues are least represented at senior level, accounting for 1.0% of the senior leadership population.
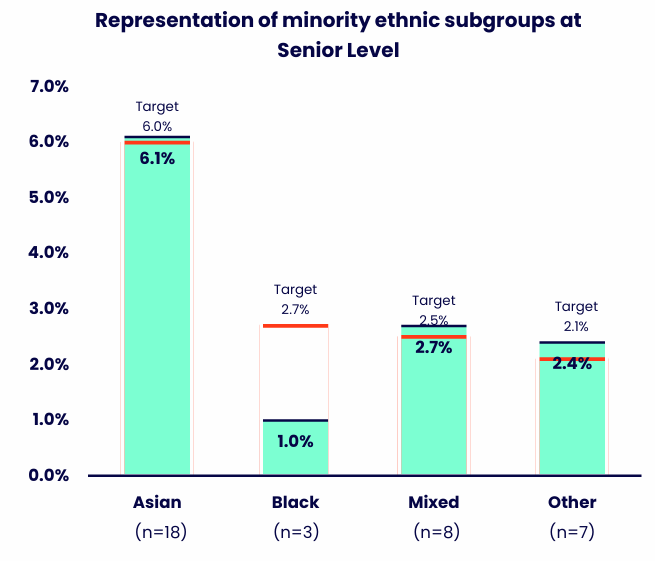
| Ethnicity subgroup | % Representation | % Target |
|---|---|---|
| Asian (n=18) | 6.1% | 6.0% |
| Black (n=3) | 1.0% | 2.7% |
| Mixed (n=8) | 2.7% | 2.5% |
| Other (n=7) | 2.4% | 2.1% |
Representation varies across minority ethnic subgroups at senior level. Most notably, the share of Black representation is significantly below target.
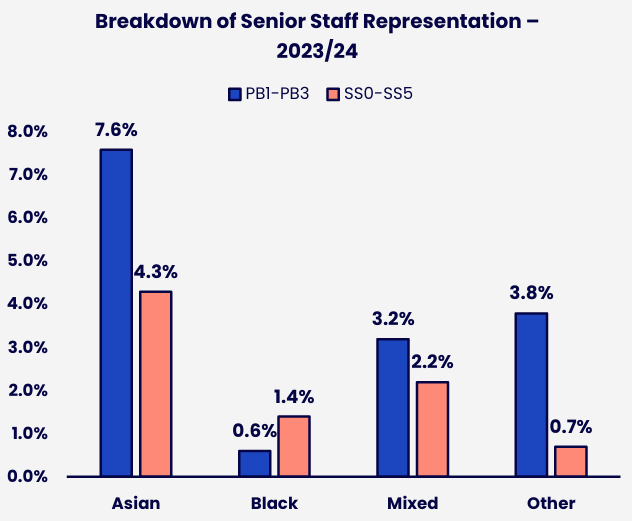
| Ethnicity subgroup | % PB1-PB3 | % SS0-SS5 |
|---|---|---|
| Asian | 7.6% | 4.3% |
| Black | 0.6% | 1.4% |
| Mixed | 3.2% | 2.2% |
| Other | 3.8% | 0.7% |
Asian staff shows highest representation across both senior level subgroups.
Snapshot date(s): 2023/24 (as at 31st July 2024)
Scope: Staff with ‘SS’ (Senior Staff) or ‘PB’ (Professor) grades – data does not include OU Partner Organisations (OUSA, OUW), research students or contingent workers
Ethnicity - Recruitment
In 2023/24, a quarter of applications (25.8%) came from candidates from Black, Asian and minority ethnic communities, a 7.2 percentage point decrease from the previous year (33% in 2022/23). Of all minority ethnic candidates interviewed, 15.5% were successful compared to 20.4% of all white applicants. Other ethnicity group candidates were least likely to be in the application pool or to be successful at interview. The unknown / no data group represents a larger proportion of applicants in 2023/24.
There is more information in the note about 2023/24 recruitment data.
| Ethnicity Group | Number of Applicants | % of Applicants | Number of Shortlisted Applicants | % of Shortlisted Applicants | Number of Appointed Candidates | % of Appointed Candidates | Proportion (%) of applicants shortlisted | Proportion (%) of shortlisted candidates interviewed | Proportion (%) appointed after interview |
|---|---|---|---|---|---|---|---|---|---|
| Black, Asian & minoritised ethnicities | 3,180 | 25.8% | 355 | 14.4% | 46 | 5.8% | 11.2% | 83.4% | 15.5% |
| White | 4,817 | 39.2% | 902 | 36.6% | 134 | 16.8% | 18.7% | 72.7% | 20.4% |
| Unknown/not shared | 4,306 | 35.0% | 1,209 | 49.0% | 616 | 77.4% | 28.1% | 85.5% | 59.6% |
| Grand Total | 12,303 | 100.0% | 2,466 | 100.0% | 796 | 100.0% | 20.0% | 80.5% | 40.1% |
| Ethnicity Group | Number of Applicants | % of Applicants | Number of Shortlisted Applicants | % of Shortlisted Applicants | Number of Appointed Candidates | % of Appointed Candidates | Proportion (%) of applicants shortlisted | Proportion (%) of shortlisted candidates interviewed | Proportion (%) appointed after interview |
|---|---|---|---|---|---|---|---|---|---|
| Asian | 1,807 | 14.7% | 223 | 9.0% | 37 | 4.6% | 12.3% | 85.2% | 19.5% |
| Black | 876 | 7.1% | 65 | 2.6% | 5 | 0.6% | 7.4% | 87.7% | 8.8% |
| Mixed | 321 | 2.6% | 48 | 1.9% | 4 | 0.5% | 15.0% | 77.1% | 10.8% |
| Other | 176 | 1.4% | 19 | 0.8% | 0 | 0.0% | 10.8% | 63.2% | 0.0% |
| White | 4,817 | 39.2% | 902 | 36.6% | 134 | 16.8% | 18.7% | 72.7% | 20.4% |
| Unknown/not shared | 4,306 | 35.0% | 1,209 | 49.0% | 616 | 77.4% | 28.1% | 85.5% | 59.6% |
| Grand Total | 12,303 | 100.0% | 2,466 | 100.0% | 796 | 100.0% | 20.0% | 80.5% | 40.1% |
Reporting period : 1st August 2023 to 31st July 2024
Scope: All Staff – Academic Staff (Central, Regional, Research and ALs) and Professional and Support Staff – data does not include OU subsidiaries (OUSA, OUW, Mulberry Bear) or agency/temp workers
Contact us
Equality, Diversity and Inclusion
The Open University
Walton Hall
Milton Keynes
MK7 6AA
Email [email protected]


Explore

Undergraduate
Postgraduate
Policy
-
Follow us on Social media
-


