

What do the long-term trends in poverty tell us about how to fix it? Joanna Mack
In his speech to the Labour Party Conference this September, Andy Burnham promised to ‘make a break with the direction of the past 40 years and put Britain on a new path’. The ascendancy of Burnham to leader of the Labour Party and Prime Minister has, it seems, opened a political space for new approaches to the UK’s economic and social problems – and to tackling the deep levels of poverty seen across the country.
In my book, Impoverished: How to fix Britain’s poverty problem, I examine the multiple causes of these increasing and deepening levels of poverty, and, crucially, the kinds of fundamental changes needed to reverse these trends. I argue that to understand the problem, we do, indeed, need to go back in time, not just to the austerity years, crucial as these are the deepening levels of poverty, but right back to the Thatcher government and the start of what’s now seen as the years of neo-liberalism. It was during this period that the high levels of poverty we see today became embedded
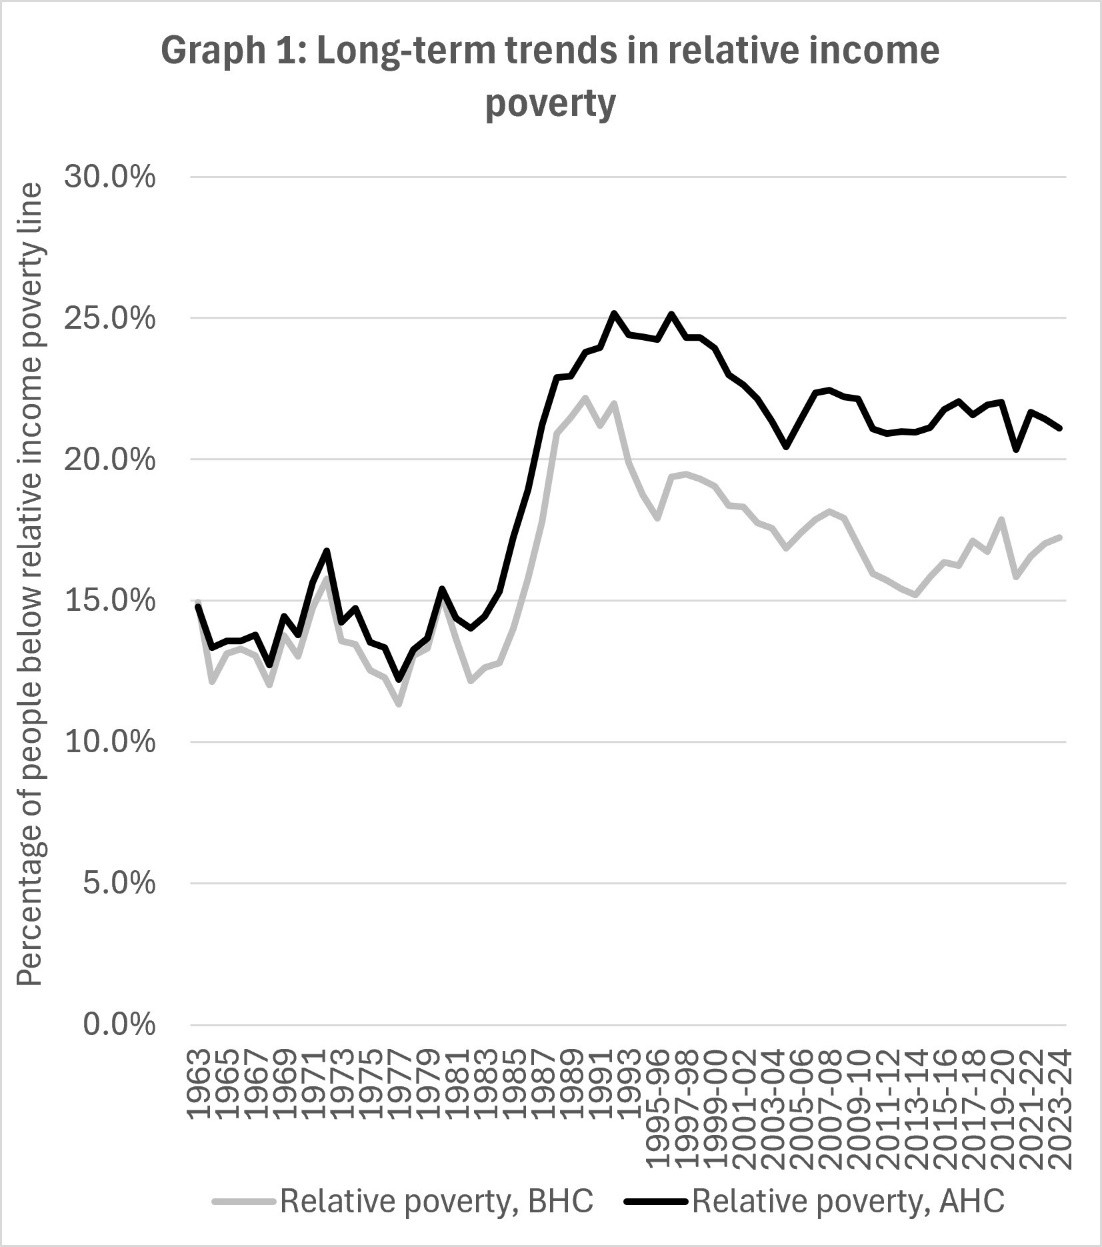
Take relative income poverty, the main measure used by governments and policy makers. It defines a household as being in poverty if the household’s income (adjusted for household composition and size) falls below 60 per cent of median household income (the mid-point). It can be measure either before housing costs (BHC) or after housing costs (AHC). From the 1960s to the start of Thatcherism in 1979, both BHC and AHC relative income poverty were very similar and fairly stable, both hovering around 12 per cent to 15 per cent (see graph 1). Both measures then grew sharply, peaking in 1992 at around 22 per cent for BHC and 25 per cent for AHC.
Margaret Thatcher believed that unleashing inequality would lead to growth and that this, in turn, would benefit all, the so-called theory of ‘trickle down’ economics. There was growth – albeit less than in the post-war years – but the result of the rising inequality was that those at the bottom were increasingly left out, unable to participate in what had come to be seen as the norm.
From the 1990s, another crucial trend kicked in, namely a growing disparity between the rates of relative income poverty before and after housing costs, with AHC rates becoming significantly higher than BHC rates. Basically, housing costs for those on lower incomes had become more expensive. Again, this was the direct result of government policies, notably the introduction of the Right to Buy under the Thatcher government and the subsequent sharp decline in council housing, which, in turn, led to the rise of private sector renting, with its higher costs. It meant that those on low household incomes had less to spend on everyday essentials.
By the mid-2000s, there had been a small drop in both rates but since then there has been little change with the AHC rate hovering around 21 per cent to 22 per cent and the BHC rate around 16 per cent to 18 per cent. While the higher levels of inequality had become deeply entrenched, the gap between the bottom and the mid-point changed little. This is because growth in the UK economy became both sluggish and increasingly skewed. What growth there was increasingly benefited those at the very top. For those in the middle and below, earnings stagnated.
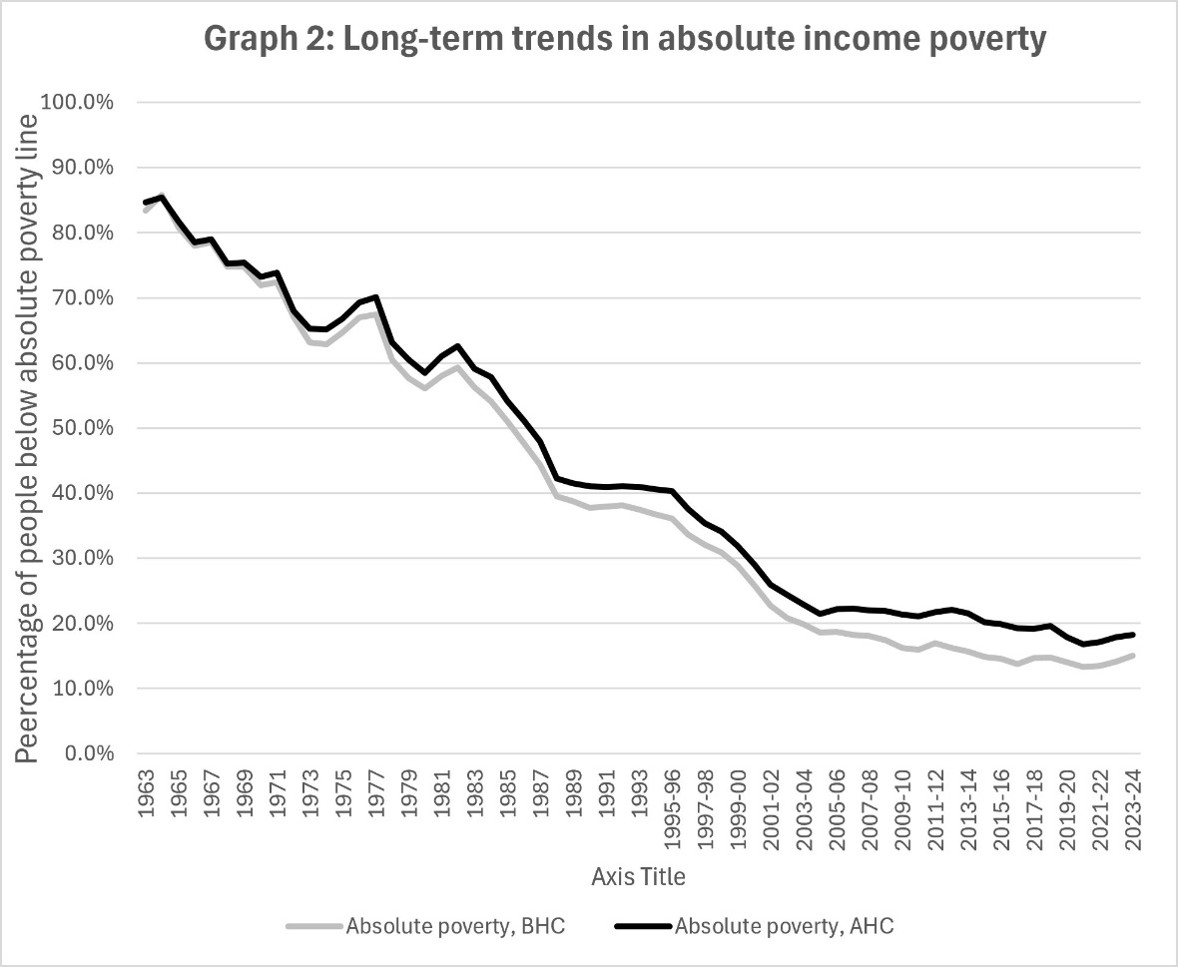
The impact of this stagnation on those at the bottom end can be seen in the trends in absolute poverty (see graph 2). This measures poverty against a fixed household income poverty line currently set at 60 per cent of median household income in 2010/11, with household incomes adjusted for inflation each year. From the early 1960s until 2004/5, absolute poverty fell as people’s living standards across the board rose. But since then, the percentage in absolute income poverty has flatlined, fluctuating around 20% for after housing costs and 16% for before housing costs. The poorest households are hardly better off than they were in the mid-2000s.
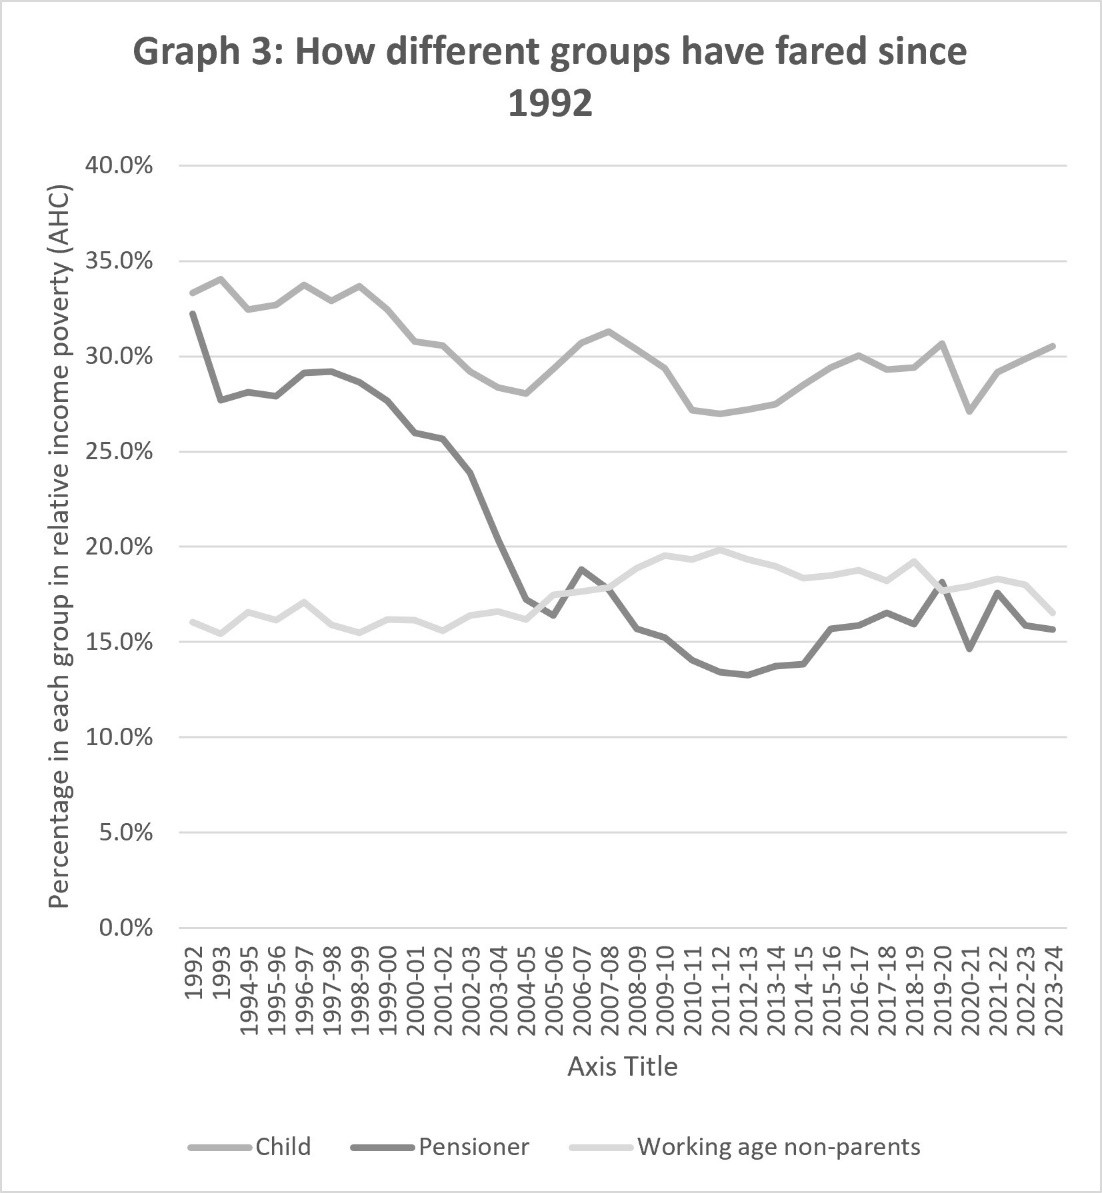
However, within these overall trends different groups have fared very differently. Graph 3 looks at trends in relative income poverty (AHC) since it peaked in the early 1990s. As can be seen pensioners have fared much better than either children or working age adults without children, with the pensioner rate dropping sharply from 30% to around 16%. This is a social policy success story and the direct result of policies – of all political parties – to improve and then protect state pensions. Moreover, for most pensioners who retired after 2016, the state pension is now above means-tested pension credit, thus providing a secure base of income on which pensioners can build without deductions.
By contrast, there is no such success story for households of working age. In the early 2000s, under the new Labour Government, there was some improvement in child poverty with the rate (AHC) dropping from 34 per cent in 1998 to 28 per cent in 2004/5. This was a direct result of various interventions to support families with children, primarily through the benefits system and introduction of child tax credit. But by the mid-2000s, this early success was petering out, and levels have subsequently increased again with the rate (AHC) now standing at around 30 per cent.
This is partly because of the decline in the value of working age and child benefits under the austerity policies of Coalition and Conservative governments of the 2010s. While the value of the basic state pension was protected, the real value of child benefit declined, and the value of various means-tested benefits declined sharply.
It is also because work has become a less successful route out of poverty than in the past. Graph 4 shows the risk of poverty for adults in households with and without children with different levels of work intensity. The same colour lines represent the same level of work intensity with double lines for households with children and single lines for those without.
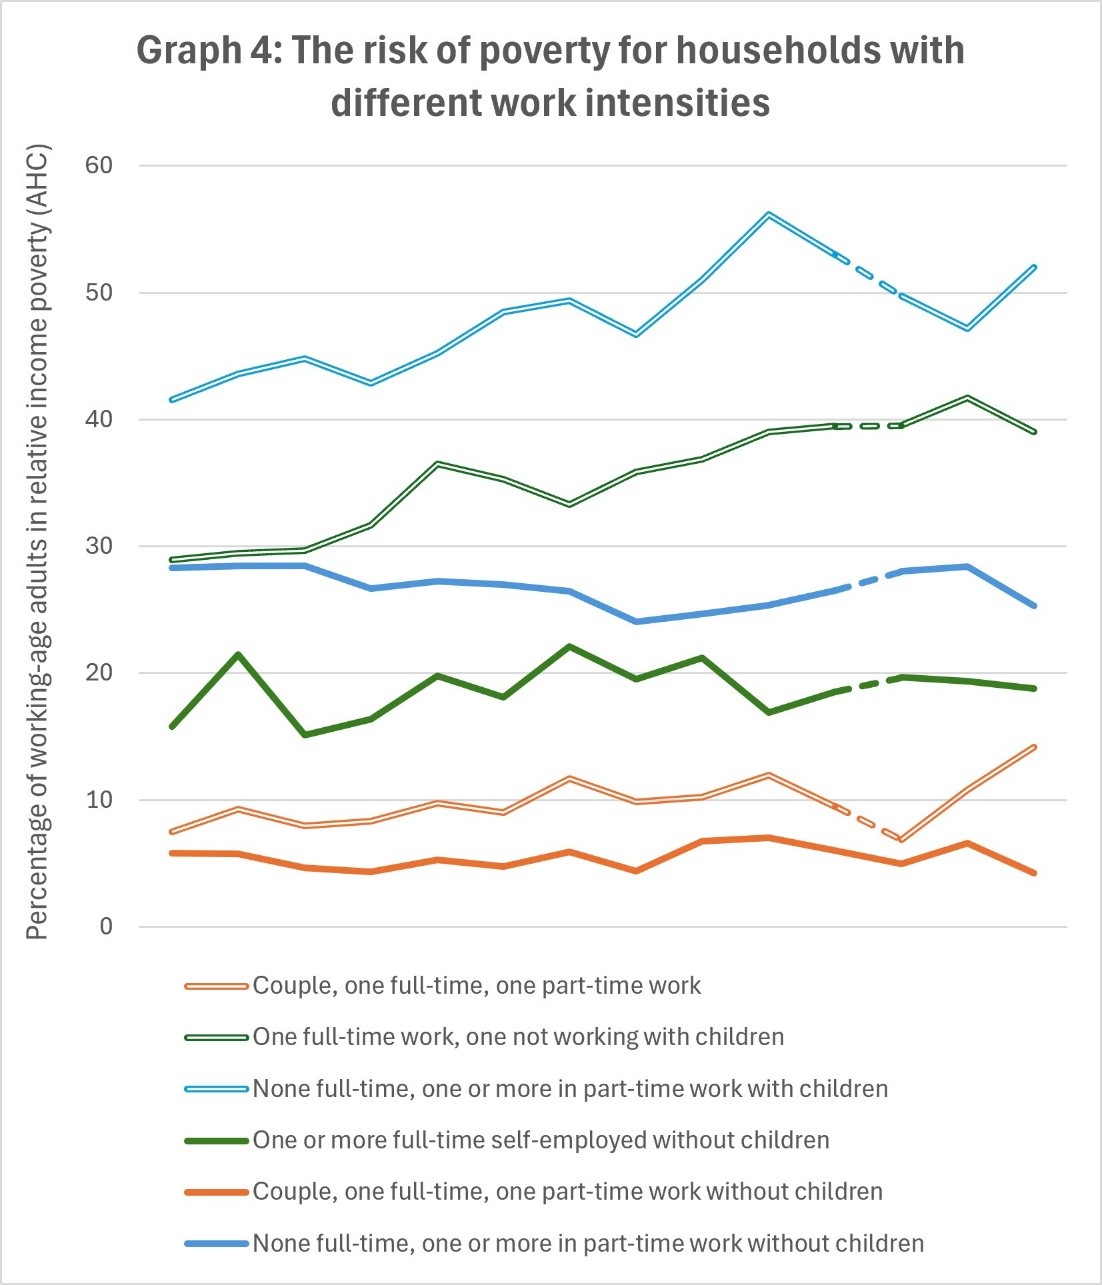
There are a number of striking features. Firstly, households with children are more likely to be in poverty than those without children and this is true whatever the work status of the household. Secondly, households are much more likely to be in poverty if there is only one earner or part-time earners. If adults have other responsibilities that limit the amount of work undertaken, such as caring for others or for reasons of disability, the risk of poverty is higher. And thirdly, households with children where no-one works full-time are far more likely to be in poverty than other households, with the risk having risen rapidly. Over half of such households are now in poverty.
And these risks are becoming widespread because of a sharp rise at the bottom end in high levels of earnings insecurity and low levels of job security. This is the result of changes in the labour market and the weakening of the bargaining power of employees that have led to the rise in on-call workers, temporary workers, zero-hours contracts and similar, often exploitative arrangements.
Zero-hour contracts, for example, rose from 143,000 in 2008 to around a million in 2019. At the same time, there has been a sharp rise in part-time working for men with the percentage of men on low hourly wages working part-time rising from 5% in 1994 to around 20 per cent today.
What guidance does this give us to the policies needed to tackle poverty? In Impoverished, I set out a range of ideas from ways to lower the costs of living and housing costs, to expanding public services, to providing income security for all.
There needs to be a fairer economic model that tackles the drivers of the continuingly high levels of inequality. This would include policies aimed at promoting growth across the country to stimulate the kinds of secure jobs that lift wages, not just at the bottom but going up the income scale through the bottom half. There also needs to be better support and improved training for those entering work and looking for work after redundancy. And employers should be required to offer more flexible working options for those providing care and with disabilities.
In addition, there needs to be changes to the benefits system. For many, the current benefits system is simply not working. It is inadequate in its levels and fails to provide a route out of poverty. For those of working age the system has become dominated by means-testing with the share of benefits going to means-tested payments rising from 25 per cent in the early 1980s to over 60 per cent in recent years. The way that means-testing has been implemented has discouraged savings, disincentivised both moving from part-time to full-time work and work progression, and, for some, moving into work at all. We need to take a different approach.
Instead, the social security needs to provide a modern version of what it was originally conceived as, namely, a way of supporting people, without recourse to means-testing, through the times when there are additional costs and needs and against unpredictable life events: increasing child benefit, proper payments to those with caring responsibilities, and financially recompensing those whose disabilities incur additional costs or limit their ability to work. This would help people move out of poverty on a long-term and sustainable basis.


Explore

Undergraduate
Postgraduate
Policy
-
Follow us on Social media
-


