
Gender, Ethnicity and Disability Pay Gap Report 2025
A PDF version of this report is available.
Please note the PDF is not optimised for accessibility. For accessible version, please find the content on the page below.
Contents
- Our Open University Pay Gaps
- Our Gender Pay Gap
- Our Ethnicity Pay Gap
- Our Disability Pay Gap
- What is the OU doing to address its pay gaps?
- Statement
Our Open University Pay Gaps
This report provides a summary of our gender, ethnicity and disability pay gaps at The Open University (OU) in 2025.
All companies with a workforce of more than 250 staff are legally required to publish data on their gender pay gap. The Open University also committed to publishing its ethnicity pay gap from 2021 and our disability pay gap from 2023.
Our 2025 pay gaps
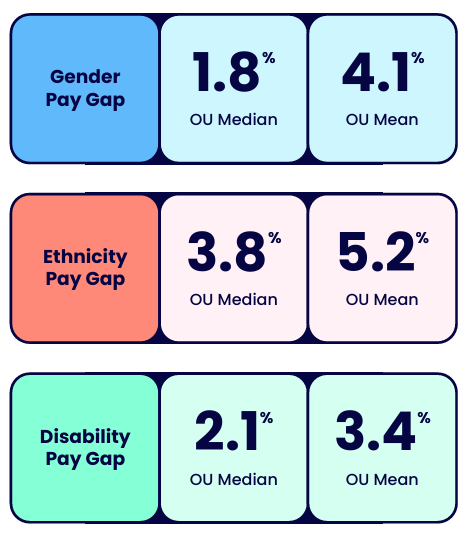
The Open University's gender pay gap is 1.8% (median) and 4.1% (mean). The ethnicity pay gap is 3.8% (median) and 5.2% (mean). The disability pay gap is 2.1% (median) and 3.4% (mean).
Our Gender Pay Gap
What is the gender pay gap?
The gender pay gap is an equality measure that shows the difference in average earnings between females and males. It is used to help us understand any inequality in earnings and identify any issues that need to be addressed. The figures contained in this report have been calculated using the methodology stipulated by UK legislation*
| Year | Median | Mean |
|---|---|---|
| Open University Gender Pay Gap 2025 | 1.8% | 4.1% |
| Open University Gender Pay Gap 2024 | 5.6% | 5.0% |
| Open University Gender Pay Gap 2023 | 6.3% | 5.3% |
| Open University Gender Pay Gap 2022 | 1.6% | 4.1% |
| Open University Gender Pay Gap 2025** | 10.2% | 10.6% |
• Note on language: For the purposes of this report, “gender” refers to pay gap calculations based on sex categories (male and female).
* Data was taken as a snapshot on 31 March 2025 (pay) and in the 12 months up to 31 March 2025 (bonus). Certain staff groups, such as consultants, are excluded from the data as per the government regulations.
** Data includes Higher Education organisations with a staff count of 5000-19,999 (gov.uk)
Employee groups – gender pay gap
There has been an overall decline in staff population, down by 6.1% year on year. Our Atypical* staff group has decreased by 18.1% year on year. Within the atypical staff group, male numbers fell by 28.3% and female numbers by 10.4%.
The median pay gap for academic staff has significantly decreased from 7.5% in 2024 to 4.7% in 2025. The mean gap for the same group has increased from 6.6% to 6.8%.
The median for professional services staff has decreased from 6.1% in 2024 to 5.6% in 2025. The mean has also shown a decline, decreasing from 6.3% in 2024 to 5.9% in 2025.
The median pay gap for Associate Lecturers has now shifted in favour of females, dropping from 2.9% in 2024 to a gap of -0.4% for 2025. The mean has done the same and has dropped from 0.9% in 2024 to -0.7% for 2025.
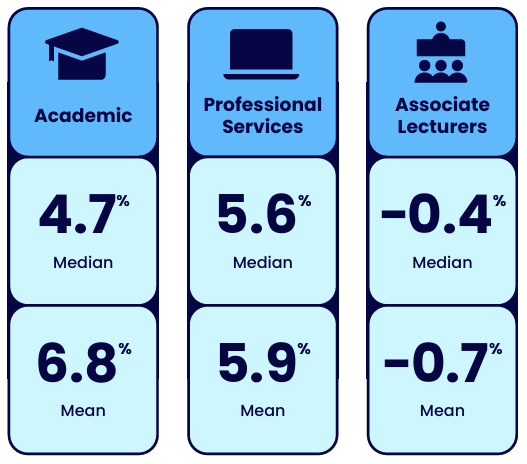
The graphic shows three staff groups. Academic staff have a median of 4.7% and a mean of 6.8%. Professional Services staff have a median of 5.6% and a mean of 5.9%. Associate Lecturers have a median of -0.4% and a mean of -0.7%.
* Employees who have non-standard employment arrangements. Atypical staff include roles such as Residential School staff and mentors, Invigilators, Examiners, Project Markers, Assessors, Day contracts, Script markers.
Pay Quartiles – gender pay gap
The data shows the distribution of females and males across all pay quartiles. Females are the majority in each quartile, with a higher concentration in the lower pay quartiles.
Reductions in headcount have resulted in changes to the distribution of staff across the pay quartiles. This year, there has been an increase in the representation of females in the upper and upper-middle quartiles, alongside increased representation of males in the lower and lower- middle quartiles. These shifts have contributed to a reduction in the Gender Pay Gap
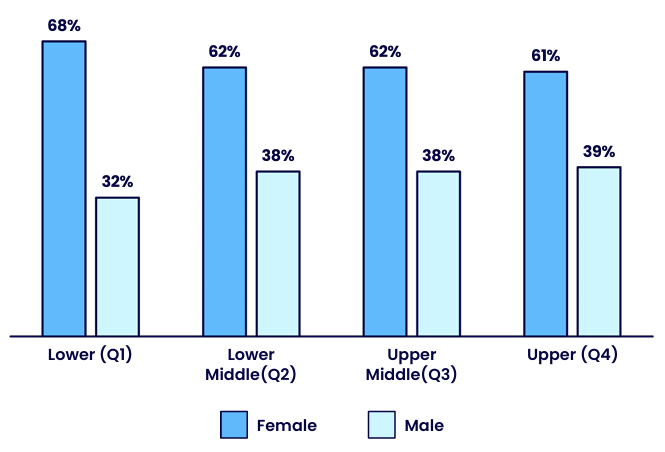
Across all pay quartiles, females represent the majority.
| Quartile | Female | Male |
|---|---|---|
| Lower (Q1) | 68% | 32% |
| Lower Middle (Q2) | 62% | 38% |
| Upper Middle (Q3) | 62% | 38% |
| Upper (Q4) | 61% | 39% |
Gender bonus pay gap
The OU median bonus gender pay gap has remained at 0% in 2025. The mean gender bonus pay gap has increased from -4.7% to 49.5%. Due to the temporary pausing of Merit Awards and Going the Extra Mile (GEM) Awards, the overall number of staff receiving a bonus has continued to decline with 715 in 2024 vs 158 in 2025. 155 of those awards were long service awards.
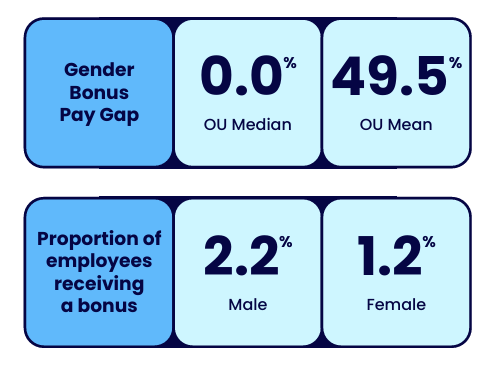
The OU median gender bonus pay gap is 0.0% and the OU mean gender bonus pay gap is 49.5%. The proportion of employees receiving a bonus is 2.2% for males and 1.2% for females.
Understanding the changes to our gender pay gap
The results from this year’s Gender Pay Gap report demonstrate a positive reduction in our pay gap. For the first time, the OU is now within the target range of +/-5% from the University’s Equality Scheme 2022-2026. The following factors have been key contributors to our gender pay gap.
Workforce Changes: Various severance schemes and local restructures implemented during the reporting period have impacted the workforce population. Full pay relative staff numbers decreased by 6.1% year on year, while atypical* staff numbers reduced by 18.1%. The Associate Lecturer (AL) population declined by 7.6% mainly due to the Associate Lecturer Voluntary Severance and other voluntary severance schemes. As a result, the AL gender pay gap is now in favour of females at -0.4%. As ALs comprise approximately 40% of the workforce, this reduction in the AL pay gap has had a significant influence on the overall University pay gaps.
Quartile Distribution: The reduction in the workforce population has shifted the distribution of staff across pay quartiles. Female representation increased by 0.8 percentage points (pp) in the upper quartile and by 3.6 pp in the upper-middle quartile. Male representation increased by 2.3 pp in both the lower and lower-middle quartiles. These changes appear to have contributed to the reduction in the Gender Pay Gap.
Academic Promotions: The reduction in the median Gender Pay Gap for academic staff represents one of the largest decreases across all staff groups. This appears to be influenced by a higher proportion of academic promotions awarded to female colleagues compared with male colleagues. Between 1 April 2024 and 31 March 2025, a total of 103 academic promotions were made, with 72 awarded to females and 31 to males, representing 70% and 30% respectively.
* Employees who have non-standard employment arrangement. Atypical staff include roles such as Residential School staff and mentors, Invigilators, Examiners, Project Markers, Assessors, Day contracts, Script markers.
Our Ethnicity Pay Gap
What is the ethnicity pay gap?
The ethnicity pay gap is calculated using the same calculation methodology as for the gender pay gap. It shows the difference in average earnings between White and Black, Asian and Minority Ethnic colleagues. The ethnicity pay gap has continued to decrease year on year.
| Year | Median | Mean |
|---|---|---|
| Open University Gender Ethnicity Pay Gap 2025 | 3.8% | 5.2% |
| Open University Gender Ethnicity Pay Gap 2024 | 5.5% | 6.2% |
| Open University Gender Ethnicity Pay Gap 2023 | 6.2% | 6.3% |
Pay Quartiles – ethnicity pay gap
Changes in headcount have altered the workforce distribution used in the pay gap calculations, resulting in increased representation of racially minoritised colleagues in the upper quartile, rising from 11% in 2024 to 13% in 2025. At the same time, White staff have a higher representation in the lower middle quartile, increasing from 78% in 2024 to 80% in 2025.
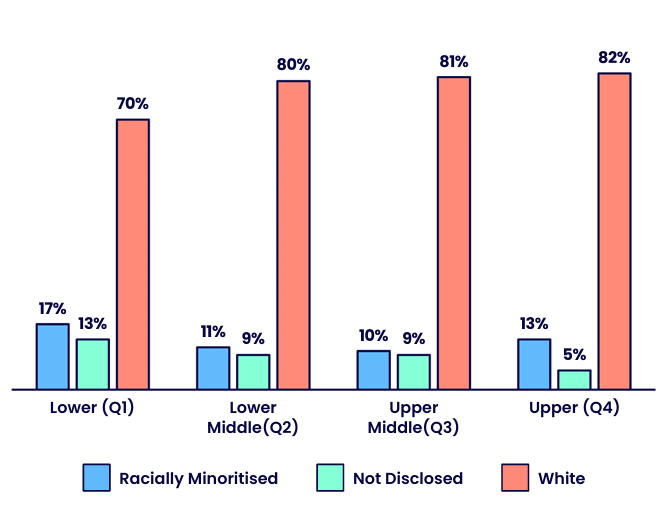
Across all pay quartiles, white people represent the majority.
| Quartile | Racially Minoritised | Not Disclosed | White |
|---|---|---|---|
| Lower (Q1) | 17% | 13% | 70% |
| Lower Middle (Q2) | 11% | 9% | 80% |
| Upper Middle (Q3) | 10% | 9% | 81% |
| Upper (Q4) | 13% | 5% | 82% |
Bonus ethnicity pay gap
The median ethnicity bonus pay gap remains unchanged at 0%, while the mean has increased to 37.2%. Comparable to the gender bonus pay gap the increase to the mean is due to the 158 payments made during the reporting period. The concentration of those payments were mostly among White staff contributing to the increase in the mean bonus pay gap.
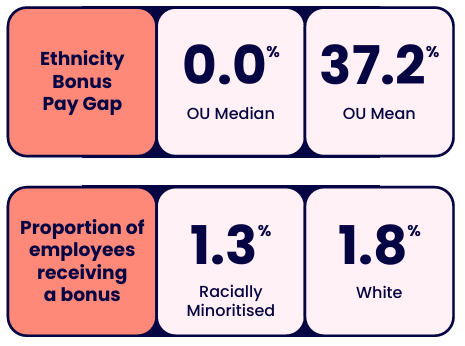
The OU median ethnicity bonus pay gap is 0.0% and the OU mean ethnicity bonus pay gap is 37.2%. The proportion of employees receiving a bonus is 1.3% for racially minoritised employees and 1.8% for white employees.
Our Disability Pay Gap
What is the disability pay gap?
The disability pay gap represents the difference in average earnings between colleagues who have disclosed a disability and those who have not. This is the third consecutive year of reporting the disability pay gap, reflecting the University’s ongoing commitment to transparency. The proportion of staff who have disclosed a disability has increased slightly this year. Alongside changes in workforce composition and distribution across pay quartiles, this coincides with a reduction in the median disability pay gap from 2.5% in 2024 to 2.1% in 2025, and an increase in the mean from 3.1% to 3.4% over the same period. The University continues to focus on improving data quality and encouraging disclosure through targeted initiatives, recognising that robust data is fundamental to understanding outcomes and supporting an inclusive workplace for colleagues with disabilities.
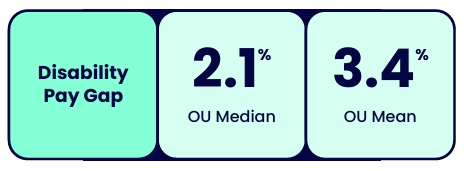
The OU median disability pay gap is 2.1% and the OU mean disability pay gap is 3.4%.
What is the OU doing to address its pay gaps?
In 2025 we have:
- Created a comprehensive mentoring framework and a ‘Mentoring at OU guide’ which is accessible to all staff. Seen increased promotion rates of female central academics to Professor, increased representation of regional academics promoted to Senior Lecturer, and the first two promotions under the 100 Black Women Professors Now scheme.
- Implemented the starting salary policy which provides guidance and criteria around starting pay for both external and internal staff, helping maintain and improve pay parity across Sex and Ethnicity.
- Created a working group to update the OU Academic Promotions framework and the associated criteria across all academic grades. We remain committed to developing a transparent, equitable, and inclusive promotions process that supports fair career progression.
- Strengthened fair and inclusive recruitment and selection practices through expanded mandatory training for hiring teams, enhanced recruiter capability and guidance, structured recruitment planning discussions including flexible working considerations, and the consistent promotion of flexible working across all job adverts. Conducted an equal pay audit, with results showing that pay differences by grade for most protected characteristics fall within the 5% tolerance.
Our next steps
Given that all three median pay gaps fall within the +/- 5% tolerance set by the Equality and Human Rights Commission and the University’s Equality Scheme 2022–2026, it is not considered proportionate at this stage to propose highly targeted, short-term actions at a granular level. In addition, pay gap reporting is based on data captured annually and published in arrears, which limits the effectiveness of setting actions on a strictly year-by-year basis.
Instead, the University will continue to focus on longer-term, sustainable approaches to maintaining favourable pay gaps and making further progress where possible.
The following areas will inform this approach:
Strategic integration: Insights from the annual pay gap analysis and equal pay audit will continue to inform the development and delivery of the University’s Equality, Diversity and Inclusion Strategy, particularly in relation to pay, progression, and access to job opportunities.
Improving data insight: The University will explore ways to strengthen the accessibility and timeliness of pay gap data to support ongoing monitoring, deeper understanding of workforce trends, and more informed decision-making over time.
Embedding inclusive practice: The University will continue to promote and embed inclusive practices through the University People Plan, with a focus on consistent and fair recruitment and progression processes across the organisation.
Statement
"The Open University is committed to fair and inclusive pay practices. Our latest pay gap analysis shows that median gender, ethnicity and disability pay gaps are within the agreed target range of +/-5%, in line with the University’s Equality Scheme 2022–2026 and EHRC guidance. We commit to continued monitoring of pay outcomes and to taking proportionate action as part of our ongoing equality, diversity and inclusion work."
Contact us
Equality, Diversity and Inclusion
The Open University
Walton Hall
Milton Keynes
MK7 6AA
Email [email protected]


Explore

Undergraduate
Postgraduate
Policy
-
Follow us on Social media
-


