
Gender, Ethnicity and Disability Pay Gap Report 2024
A PDF version of this report is available.
Please note the PDF is not optimised for accessibility. For accessible version, please find the content on the page below
Contents
- Our Open University Pay Gaps
- Our Gender Pay Gap
- Our Ethnicity Pay Gap
- Our Disability Pay Gap
- What is the OU doing to address its pay gaps?
- Statement
Our Open University Pay Gap
This report provides a summary of our gender, ethnicity and disability pay gaps at The Open University in 2024. All companies with a workforce of more than 250 staff are legally required to publish data on their gender pay gap. The Open University also committed to publishing its ethnicity pay gap from 2021 and our disability pay gap from 2023.
Our 2024 pay gaps
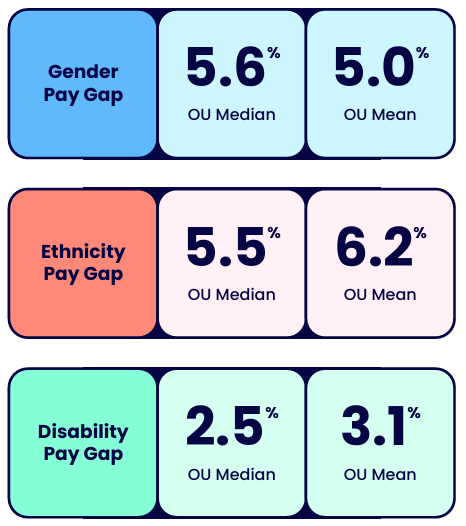
The Open University's gender pay gap is 5.6% (median) and 5.0% (mean). The ethnicity pay gap is 5.5% (median) and 6.2% (mean). The disability pay gap is 2.5% (median) and 3.1% (mean).
Our Gender Pay Gap
What is the gender pay gap?
The gender pay gap is an equality measure that shows the difference in average earnings between women and men. It is used to help us understand any inequality in earnings and identify any issues that need to be addressed. The figures contained in this report have been calculated using the methodology stipulated by UK legislation*.
Pay gaps are not the same as equal pay. Equal pay, as set out by the Equality Act 2010, is the legal obligation to pay the same earnings to two people doing the same job or work of equal value. Pay gaps measure the difference in average pay regardless of job role or level.
| Year | Median | Mean |
|---|---|---|
| Open University Gender Pay Gap 2024 | 5.6% | 5.0% |
| Open University Gender Pay Gap 2023 | 6.3% | 5.3% |
| Open University Gender Pay Gap 2022 | 1.6% | 4.1% |
| Open University Gender Pay Gap 2021 | 13.3% | 8.7% |
| Open University Gender Pay Gap 2023† | 12.1% | 14.7% |
* Data was taken as a snapshot on 31 March 2024 (pay) and in the 12 months up to 31 March 2024 (bonus). Certain staff groups, such as consultants, are excluded from the data as per the government regulations.
† Data includes Higher Education organisations with a staff count of 5000-19,999 (gov.uk)
Employee groups – gender pay gap
The composition of staff has shifted, with an increased proportion of women across all staff groups, except for the Atypical* staff group, which predominantly comprises men.
There has been a decrease of 3.9% in Professional Services staff year on year.
The mean pay gap for Academic Staff has decreased from 7.4% in 2023 to 6.6% in 2024. The median gap for the same group has increased from 7.1% to 7.5%.
The mean for Professional Services staff has experienced a slight increase, rising from 6.0% in 2023 to 6.3% in 2024. The median has shown a notable decline, decreasing significantly from 8.5% in 2023 to 6.1% in 2024, mainly due to the reduction in the number of staff in that group and a higher population of women.
The mean pay gap for Associate Lecturers has shifted from 0.6% to a gap of 0.9% for 2024, whilst the median has seen a decrease of 0.4% ppts to 2.9% for 2024.
* Employees who have non-standard employment arrangements. Atypical staff include roles such as Residential School staff and mentors, Invigilators, Examiners, Project Markers, Assessors, Day contracts, Script markers.
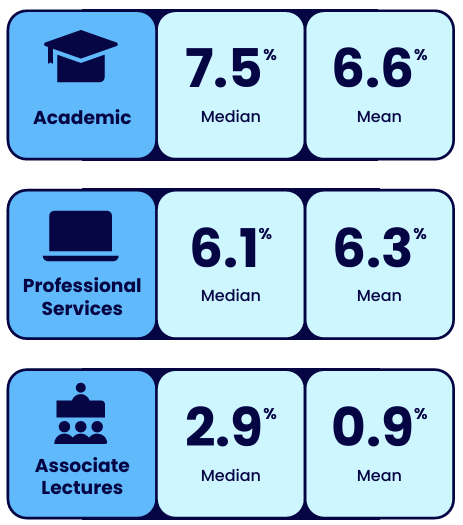
The graphic shows three staff groups. Academic staff have a median of 7.5% and a mean of 6.6%. Professional Services staff have a median of 6.1% and a mean of 6.3%. Associate Lecturers have a median of 2.9% and a mean of 0.9%.
Pay Quartiles – gender pay gap
The data shows the distribution of women and men between all pay quartiles. Women are in the majority of all four pay quartiles with higher concentration in the lower quartiles.
The representation of women and men has remained the same in comparison to last year.
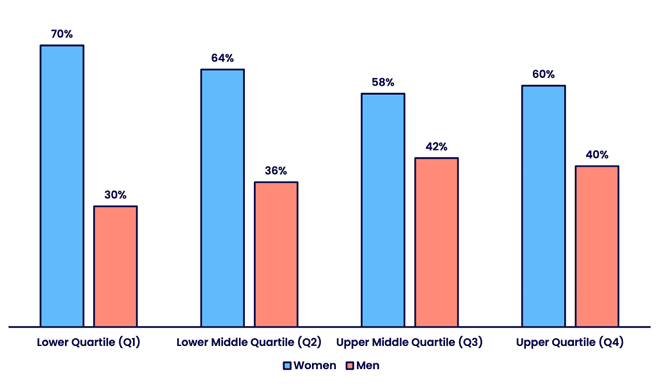
Across all pay quartiles, Women represent the majority.
| Quartile | Female | Male |
|---|---|---|
| Lower (Q1) | 70% | 30% |
| Lower Middle (Q2) | 64% | 36% |
| Upper Middle (Q3) | 58% | 42% |
| Upper (Q4) | 60% | 40% |
Gender bonus pay gap
This year our median bonus gender pay gap has decreased from 50% in 2023 to 0.0% in 2024. The mean gender bonus pay gap has decreased from 22% to -4.7%.
Due to the temporary pausing of Merit Awards and Going the Extra Mile (GEM) Awards, the overall number of staff receiving a bonus has declined significantly with 1402 people in 2023 vs 715 in 2024, with more women receiving a bonus in 2024.
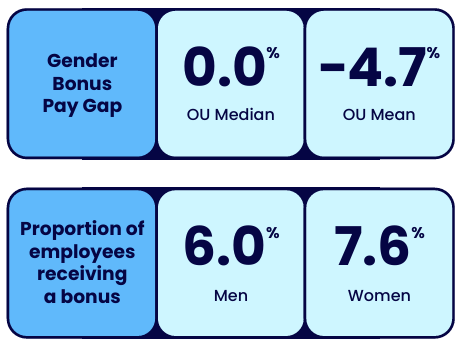
The OU median gender bonus pay gap is 0.0% and the OU mean gender bonus pay gap is -4.7%. The proportion of employees receiving a bonus is 6.0% for males and 7.6% for females.
Understanding the changes to our gender pay gap
The results from this year’s Gender Pay Gap Report demonstrate a positive reduction in our pay gap. The following factors have been key contributors to our gender pay gap, highlighting areas of progress as well as opportunities for further improvement.
Workforce Changes: A 43.5% increase in Atypical* staff and a 2.8% decrease in Associate Lecturers (ALs) has reshaped our workforce composition. While the overall workforce has slightly decreased, the gender balance has shifted, resulting in a higher proportion of women across all staff groups. This, combined with the significant increase in Atypical staff— who have a 0% GPG—has been a key driver in narrowing the gender pay gap this year.
Quartile Distribution: Although the proportion of women (%) remained stable across quartiles, shifts in staff group distribution affected the overall pay structure. Associate Lecturers (ALs), a group with a higher representation of women, saw an increase in the lower quartiles (+3%) and a decrease in the upper quartiles (-3%). This redistribution has created challenges in narrowing the gender pay gap.
New Hires: Women accounted for 67% of new hires; however, their median starting salaries were lower than those of men across multiple grades. To address this disparity, we have introduced a Starting Salary Policy to promote greater equity in initial pay levels.
* Employees who have non-standard employment arrangement. Atypical staff include roles such as Residential School staff and mentors, Invigilators, Examiners, Project Markers, Assessors, Day contracts, Script markers.
Our Ethnicity Pay Gap
What is the ethnicity pay gap?
The ethnicity pay gap is calculated using the same calculation methodology as for the gender pay gap. It shows the difference in average earnings between white and Black, Asian and Minority Ethnic colleagues.
The ethnicity pay gap has continued to decrease year on year.
| Year | Median | Mean |
|---|---|---|
| Open University Gender Ethnicity Pay Gap 2024 | 5.5% | 6.2% |
| Open University Gender Ethnicity Pay Gap 2023 | 6.2% | 6.3% |
| Open University Gender Ethnicity Pay Gap 2022 | 6.5% | 7.8% |
Pay Quartiles – ethnicity pay gap
The number of white staff has decreased by 413, and the number of staff who have not disclosed their ethnicity has increased by 211. The number of Black, Asian, and Minority Ethnic staff has remained the same.
There has been a slight shift in Black, Asian, and Minority Ethnic staff to the Upper and Upper Middle quartiles since last year which has positively contributed to closing our ethnicity pay gap.
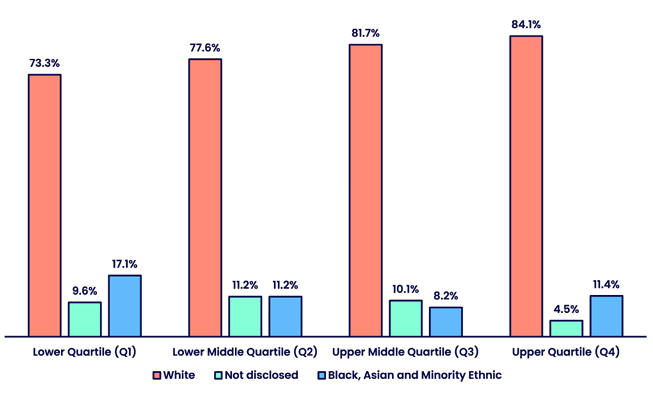
Across all pay quartiles, white people represent the majority.
| Quartile | Racially Minoritised | Not Disclosed | White |
|---|---|---|---|
| Lower (Q1) | 17.1% | 9.6% | 73.3% |
| Lower Middle (Q2) | 11.2% | 11.2% | 77.6% |
| Upper Middle (Q3) | 8.2% | 10.1% | 81.7% |
| Upper (Q4) | 11.4% | 4.5% | 84.1% |
Bonus ethnicity pay gap
The median ethnicity bonus pay gap has significantly decreased to 0.0%, while the mean now reflects a positive difference for Black, Asian, and Minority Ethnic employees.
The temporary pause of GEM and Merit Awards has significantly contributed to a reduction in these figures. The decrease in the number of white staff could also be an influencing factor in the reduction overall.
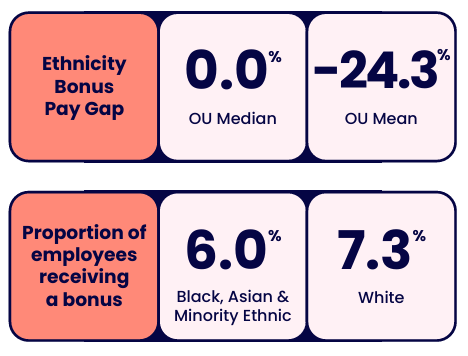
The OU median ethnicity bonus pay gap is 0.0% and the OU mean ethnicity bonus pay gap is -24.3%. The proportion of employees receiving a bonus is 6.0% for racially minoritised employees and 7.3% for white employees.
Our Disability Pay Gap
What is the disability pay gap?
The disability pay gap represents the difference in average earnings between colleagues who have disclosed a disability and those who have not.
This marks the second consecutive year of reporting the disability pay gap, demonstrating the institution’s commitment to fostering greater transparency. The number of staff members who have disclosed a disability has increased, contributing to a slight rise in both the mean and median pay gaps. The university remains dedicated to improving data quality through targeted initiatives and encouraging higher disclosure rates, which are integral to cultivating an inclusive culture for colleagues with disabilities.
| Year | Median | Mean |
|---|---|---|
| Open University Gender Disability Pay Gap 2024 | 2.5% | 3.1% |
| Open University Gender Disability Pay Gap 2023 | 6.2% | 2.9% |
What is the OU doing to address its pay gaps?
Equity is a strategic goal at The Open University and we are committed to ensuring fairness across all aspects of our work.
Our pay gaps are an important way for us to measure progress and hold ourselves accountable for creating a more equitable and inclusive workplace where everyone can succeed.
The below actions form part of a long-term action plan developed to help close our pay gaps. Our areas of focus include supporting staff development, promotion and career progression, promoting fairness in recruitment and selection processes, and achieving equity in how we pay our people.
In 2024 we have:
- Made steady progress with our Race Equality Charter and Athena Swan submissions for 2025 and 2026, as we support our commitments to improving representation, progression, promotion, and inclusion in race and gender equality.
- Progressed a robust evidence template for our Disability Confident Level 2 (Disability Confident Employer) submission by the end of 2025.
- Implemented a new recruitment and onboarding module that allows us to record, monitor and improve the constitution of our recruitment panels, reduce manual processes and bias at all stages of recruitment/selection and allow for alternative recruitment options.
- Supported the development of our staff through appropriate mentoring arrangements, including the third cohort of our Reciprocal Mentoring programme.
- Reviewed guidance on options for flexible working including job sharing, compressed working hours and part time working.
- Supported promotion and career progression through women’s leadership development programmes such as 100 Black Women Professors NOW and the Aurora Programme
Our next steps:
- Conduct an equal pay review in 2025 to ensure fairness, compliance, and improved workplace culture.
- Continue developing our evidence template to work towards Disability Confident Level 3 (Disability Confident Leader).
- Implement a new starting salaries policy to reduce disparities and address inequities in the salaries offered to new hires.
- Analyse results from our first-ever EDI Staff Survey to understand staff perceptions of fairness and inclusion, and develop targeted actions based on the findings.
- Develop and implement innovative practices around job sharing, career breaks, promotion, parental and caregiving leave to support staff appropriately at various stages in their careers. This will include the launch of the OU’s first ‘job-sharing week’.
- Develop university-wide and unit-specific dashboards tailored to the data requirements of Athena Swan and the Race Equality Charter, supporting detailed data analysis for creating action plans, measuring their impact, and guiding decisions to improve race and gender equality.
Statement
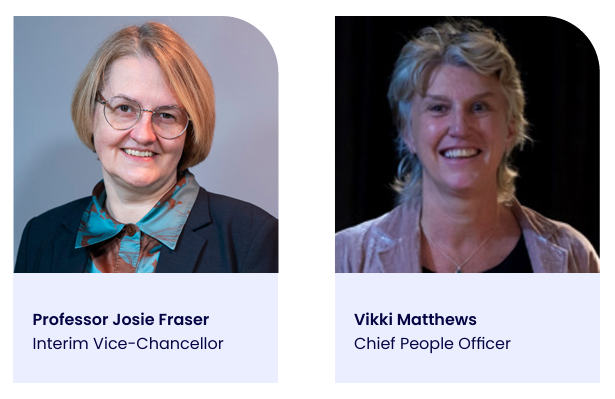
"At The Open University we are committed to addressing our gender, ethnicity and disability pay gaps through data-driven, meaningful actions. We will continue to monitor and address these gaps as part of our ongoing commitment to equality, diversity and inclusion."
Contact us
Equality, Diversity and Inclusion
The Open University
Walton Hall
Milton Keynes
MK7 6AA
Email [email protected]


Explore

Undergraduate
Postgraduate
Policy
-
Follow us on Social media
-


