
Gender, Ethnicity and Disability Pay Gap Report 2023
A PDF version of this report is available.
Please note the PDF is not optimised for accessibility. For accessible version, please find the content on the page below.
Contents
- Our Open University Pay Gaps
- Our Gender Pay Gap
- Our Ethnicity Pay Gap
- Our Disability Pay Gap
- What is the OU doing to address its pay gaps?
- Statement
Our Open University Pay Gaps
This report provides a summary of our gender, ethnicity and disability pay gaps at The Open University in 2023.
All companies with a workforce of more than 250 staff are legally required to publish data on their gender pay gap. In 2021, The Open University also committed to publishing its ethnicity pay gap and this year we are voluntarily publishing our disability pay gap. This is part of our wider plan for embedding equality, diversity and inclusion (EDI) within the institution and being more open and transparent about our people.
Our 2023 pay gaps
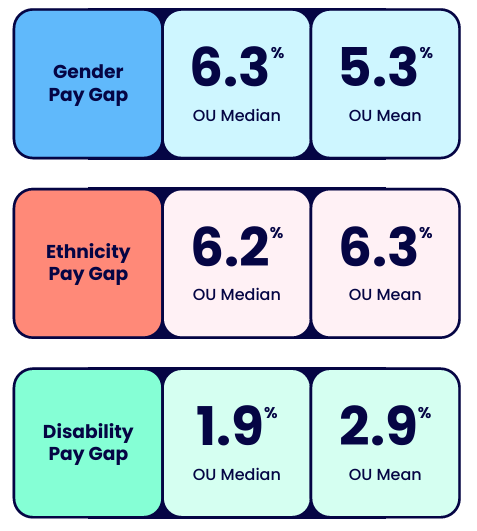
The Open University's gender pay gap is 6.3% (median) and 5.3% (mean). The ethnicity pay gap is 6.2% (median) and 6.3% (mean). The disability pay gap is 1.9% (median) and 2.9% (mean).
Our Gender Pay Gap
What is the gender pay gap?
The gender pay gap is an equality measure that shows the difference in average earnings between women and men. It is used to help us understand any inequality in earnings and identify any issues that need to be addressed. The figures contained in this report have been calculated using the methodology stipulated by UK legislation*.
| Year | Median | Mean |
|---|---|---|
| Open University Gender Pay Gap 2023 | 6.3% | 5.3% |
| Open University Gender Pay Gap 2022 | 1.6% | 4.1% |
| Open University Gender Pay Gap 2022 | 13.3% | 8.7% |
| Open University Gender Pay Gap 2020 | 5.7% | 5.7% |
| Education Sector Pay Gap 2022 † | 13.1% | 15.8 |
* Data was taken as a snapshot on 31 March 2023 (pay) and in the 12 months up to 31 March 2023 (bonus). Data includes all employees who have an employment contract and were on the University’s payroll as at 31 March 2023.
† Data includes Higher Education organisations with a staff count of 5000-19,999 (gov.uk)
Employee groups – gender pay gap
Movement across the employment groups has been minimal annually and less than 1%, except for Associate Lecturers.
The mean academic staff pay gap has decreased from 7.6% in 2022 to 7.5% in 2023. The median gap for the same group has remained static at 7.1%.
The professional services staff mean has grown marginally from 5.9% in 2022 to 6.0% in 2023, along with the median which has also seen an increase, rising from 7.8% to 8.5%.
The mean pay gap for Associate Lecturers has risen from –1.7% to a more neutral gap of 0.6% for 2023, whilst the median has seen an increase of 3.6 percentage points (ppts) to 3.3% for 2023.
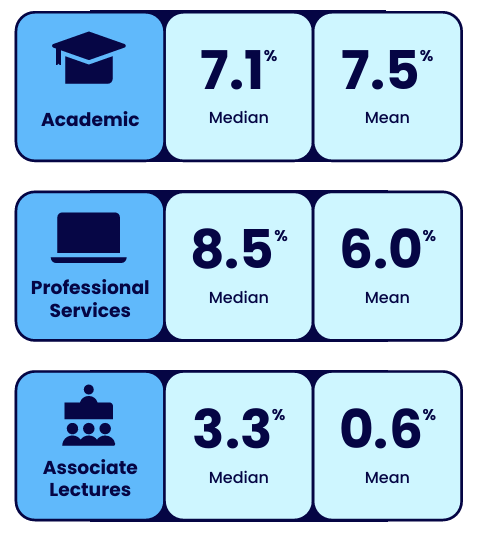
The graphic shows three staff groups. Academic staff have a median of 7.1% and a mean of 7.5%. Professional Services staff have a median of 8.5% and a mean of 6.0%. Associate Lecturers have a median of 3.3% and a mean of 0.6%.
Pay Quartiles – gender pay gap
The data shows the distribution of women and men between all pay quartiles. Women are in the majority of all 4 pay quartiles.
This year we have seen a 5% increase in the proportion of women moving towards the 2 lower quartiles, which has contributed to our gender pay gap.
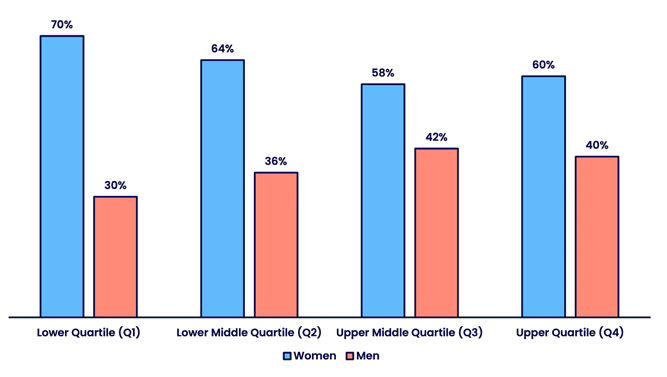
Across all pay quartiles, Women represent the majority.
| Quartile | Female | Male |
|---|---|---|
| Lower (Q1) | 70% | 30% |
| Lower Middle (Q2) | 64% | 36% |
| Upper Middle (Q3) | 58% | 42% |
| Upper (Q4) | 60% | 40% |
Gender bonus pay gap
This year our median bonus gender pay gap has increased from 0.0% in 2022 to 50.0% in 2023. The mean gender bonus pay gap has decreased from 22.5% to 22%.
The median gender bonus pay gap is attributed to the impact of Going the Extra Mile (GEM) awards, constituting 60.7% of the total bonuses issued. The mean gender pay gap is driven by the annual commission scheme applicable to 1 specific unit.
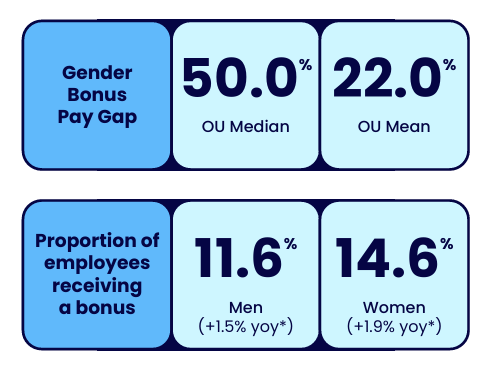
The OU median gender bonus pay gap is 50.0% and the OU mean gender bonus pay gap is 22.0%. The proportion of employees receiving a bonus is 11.6% for males, +1.5% year on year , and 14.6% for females, +1.9% year on year.
Understanding the changes to our gender pay gap
After a period of exceptional circumstances, our 2023 gender pay gap aligns more closely with data from 2020 and previous years. The below factors have predominantly contributed to our pay gap and we are implementing measures to address these as part of our action plan.
Professional Services impact: Professional Services account for 42.6% of the University’s employees. Within this employment group, women comprise 68% of the workforce and notably are concentrated within the lower and lower middle quartiles, which is impacting our median pay gap by 6.2 ppts and our mean pay gap by 3.0 ppts.
Grade 7 Pervasiveness: There is a heavy concentration of Professional Services and Associate Lecturer employees (55%) in Grade 7 roles. Within this group, women constitute 61% of the population. Our median pay gap results are significantly influenced by this cohort due to the way the figures are calculated.
Starting salaries: Pay disparities between male and female new starters have influenced the University’s 2023 pay gap and are more pronounced amongst external hires, with men on average starting 2 spinal points higher than women
Our Ethnicity Pay Gap
What is the ethnicity pay gap?
The ethnicity pay gap is calculated using the same calculation methodology as for the gender pay gap. It shows the difference in average earnings between white and Black, Asian and Minority Ethnic colleagues.
This is the third year we have published the ethnicity pay gap, in line with our new EDI strategy to show greater transparency, demonstrate accountability and identify inequalities that need to be addressed.
Both our median and mean ethnicity pay gaps have improved further annually by -0.3 ppts and –1.5 ppts respectively.
| Year | Median | Mean |
|---|---|---|
| Open University Gender Ethnicity Pay Gap 2023 | 6.2% | 6.3% |
| Open University Gender Ethnicity Pay Gap 2022 | 6.5% | 7.8% |
| Open University Gender Ethnicity Pay Gap 2021 | 20.1% | 13.2% |
Pay Quartiles – ethnicity pay gap
The biggest movements annually in the pay quartiles have come from the lower quartiles for both white colleagues (+9.8%) and Black, Asian and Minority Ethnic colleagues (+2.9%).
Work was undertaken last year to improve declaration rates. This has resulted in a significant increase in colleagues identifying as Black, Asian and Minority Ethnic and a decrease in the count of individuals who did not declare.
The increase in the disclosure of ethnicity contributes to more comprehensive and accurate representation in each quartile and enhances the University’s precision of our ethnicity pay gap analysis.
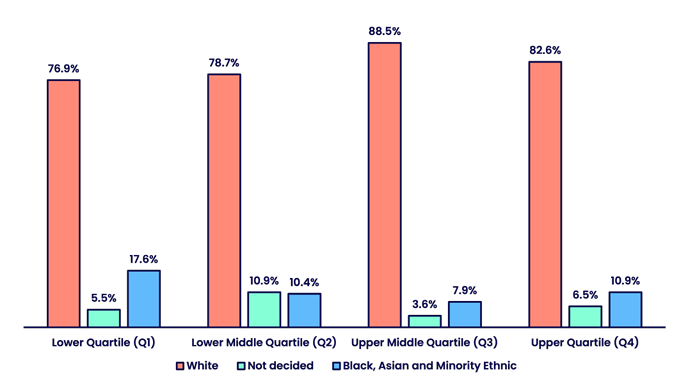
Across all pay quartiles, white people represent the majority.
| Quartile | Racially Minoritised | Not Disclosed | White |
|---|---|---|---|
| Lower (Q1) | 17.6% | 5.5% | 76.9% |
| Lower Middle (Q2) | 10.4% | 10.9% | 78.7% |
| Upper Middle (Q3) | 7.9% | 3.6% | 88.5% |
| Upper (Q4) | 10.9% | 6.5% | 82.6% |
Bonus ethnicity pay gap
The median and mean bonus pay gaps have increased annually by 37.5 ppts and 3.9 ppts respectively.
The main driver for this increase is the distribution of bonus payment types. Black, Asian, and Minority Ethnic employees are underrepresented within the Merit category compared to their white counterparts and are overrepresented in the GEM category. More GEMs were issued to Black, Asian and Minority Ethnic colleagues than Merits and this has influenced the Ethnicity Bonus Pay Gap.
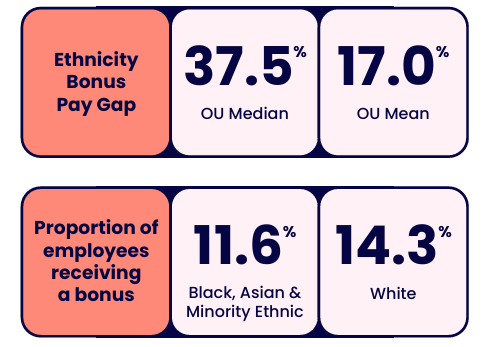
The OU median ethnicity bonus pay gap is 37.5% and the OU mean ethnicity bonus pay gap is 17.0%. The proportion of employees receiving a bonus is 11.6% for racially minoritised employees and 14.3% for white employees.
Our Disability Pay Gap
What is the disability pay gap?
The disability pay gap shows the difference in average earnings between colleagues with a declared disability and colleagues who have not declared a disability.
This is the first year we are publishing our disability pay gap as a step towards affording greater transparency. Our disability pay gap is low, but we recognise that it may not provide a fully accurate picture due to limited data. We are committed to improving the quality of our data through increased declaration rates and implementing measurable actions that help create a more inclusive culture for colleagues with a disability.
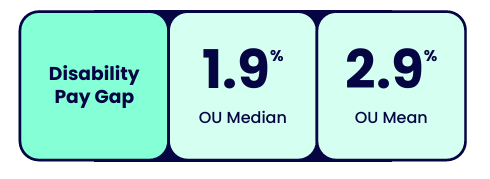
The OU median disability pay gap is 1.9% and the OU mean disability pay gap is 2.9%.
What is the OU doing to address its pay gaps?
Understanding and addressing our pay gaps is important. It holds us accountable for the fair, inclusive culture we want to see at the OU. Though we have seen some changes to our gaps, we remain committed to reducing these and meeting the objectives and actions outlined in our Institutional Equality, Diversity and Inclusion (EDI) Plan and Equality Scheme.
We acknowledge that our pay gaps will fluctuate as we work to improve declaration rates and implement new initiatives. We are prioritising long term actions that build on our ongoing commitments and help improve representation across our most senior roles.
What have we achieved since publishing our 2022 report?
- We have made progress towards our Charter submissions. We convened our Athena Swan Self-Assessment Team (SAT) to work on gender equality data analysis and evaluations of staff representation, experience, reward and recognition and career progression across the institution. Our Race Equality Charter working groups have had regular meetings, putting plans in place to evaluate processes that have an impact on the ethnicity pay gap at the university.
- We set up a working group of key action owners to develop a robust evidence template for our Disability Confident Level 2 (Disability Confident Employer) and Disability Confident Level 3 (Disability Confident Leader) applications.
- We undertook an equal pay review in January 2023. Actions taken following this report include the introduction of the starting salary policy, which has been created to provide greater autonomy to line managers in support of pay equity within teams.
- We established the Women’s Development Community to support the progression and development of women at the OU.
- The latest Senior Executive Leadership programme cohort began in September 2022 and members of the cohort were selected via expressions of interest with a positive action approach to encourage participation from under-represented groups. Of 15 members of the cohort 6 were women and 3 were members of the Black Asian and Minority Ethnic community.
What are we planning to do in 2024?
Charters and initiatives
- We plan to submit our application for Disability Confident Level 2 (Disability Confident Employer) in 2024. This is a robust self-assessment framework focussed on how we recruit and develop our people.
- We will progress our action plans to take forward our Athena Swan Silver and Race Equality Charter submissions by the end of 2026.
- We are introducing University-level and unit-level dashboards tailored to Athena Swan and Race Equality Charter data requirements. These will support the rigorous data analysis process relied upon for developing action plans, evidencing the impact of action plans, and decision making to improve race and gender equality.
Pay and reward
- We will continue to monitor and provide units with reward data that includes protected characteristics for pay reviews and Going the Extra Mile (GEM) awards.
- We will continue to conduct pay analysis annually and adjust, where required, individual pay for equality purposes.
Promotion, development and progression
- We will roll out the reciprocal mentoring programme across the University to ensure staff have the opportunity to learn from the lived experience of diverse colleagues.
- We will monitor progress of the changes to our academic promotions criteria and framework.
We will continue to engage in leadership development programmes by offering places on the Aurora Programme for women and supporting career progression for Black women through participation in the ‘100 Black Women Professors NOW’ UK-wide project.
Statement
"At the Open University we are committed to addressing our gender, ethnicity and disability pay gaps through data-driven, meaningful actions. We will continue to monitor and address these gaps as part of our commitment to a fair and inclusive workplace."
Contact us
Equality, Diversity and Inclusion
The Open University
Walton Hall
Milton Keynes
MK7 6AA
Email [email protected]


Explore

Undergraduate
Postgraduate
Policy
-
Follow us on Social media
-


