
Gender and Ethnicity Pay Gap Report 2021
A PDF version of this report is available.
Please note the PDF is not optimised for accessibility. For accessible version, please find the content on the page below.
Contents
- Our Open University Pay Gaps
- Our Gender Pay Gap
- Our Ethnicity Pay Gap
- What is the OU doing to address its pay gaps?
- Statement
Our Open University Pay Gaps
This report provides a summary of our gender and ethnicity pay gaps at The Open University in 2021.
All companies with a workforce of more than 250 staff are legally required to publish data on their gender pay gap. From 2021, The Open University has committed to also publishing its ethnicity pay gap. This is part of our wider plan for embedding equality, diversity and inclusion (EDI) within the institution and affording greater transparency.
Our 2021 pay gaps
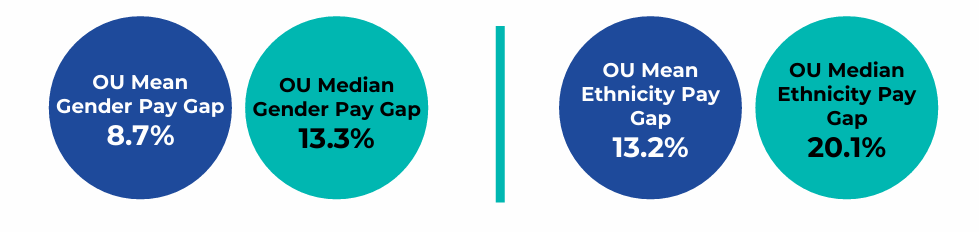
The Open University's gender pay gap is 13.3% (median) and 8.7% (mean). The ethnicity pay gap is 20.1% (median) and 13.2% (mean).
Our Gender Pay Gap
What is the gender pay gap?
The gender pay gap is an equality measure that shows the difference in average (mean) and median earnings between women and men. It is used to help us understand any inequality in earnings between men and women and identify any issues that need to be addressed. The figures contained in this report have been calculated using the methodology stipulated by UK legislation.
| Year | Median | Mean |
|---|---|---|
| Open University Gender Pay Gap 2021 | 13.3% | 8.7% |
| Open University Gender Pay Gap 2020 | 5.7% | 5.7% |
| HE Sector Pay Gap 2020 | 11.3% | 14% |
Data was taken as a snapshot on 31 March 2021 (pay) and in the 12 months up to 31 March 2021 (bonus). The Open University has excluded Consultants as the data required to calculate the gender pay gap is not available . This is in line with the regulations.
Employee groups – gender pay gap
Looking at the main employee groups, mean and median pay gaps between men and women are smallest for Associate Lecturers (tutors), although both mean and median pay gaps have increased since 2020.
The mean academic staff pay gap has increased for the last two years, from 4.2% in 2019 to 8.1% in 2021. The median gap for the same group also increased from 5.0% in 2019 to 7.2% in 2021. The professional services staff mean and median pay gaps have fallen from 6.5% and 8.2% in 2019, respectively.
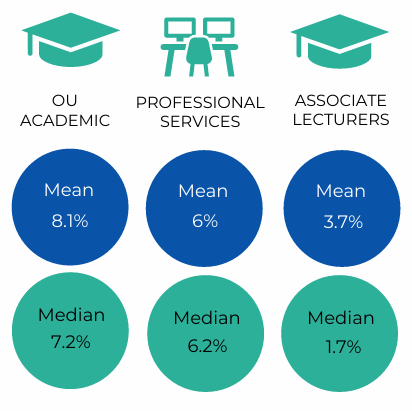
The graphic shows three staff groups. Academic staff have a median of 7.2% and a mean of 8.1%. Professional Services staff have a median of 6.2% and a mean of 6%. Associate Lecturers have a median of 1.7% and a mean of 3.7%.
Pay Quartiles – gender pay gap
The data below shows the distribution of women and men between all pay quartiles. The lower quartiles have a higher proportion of women and this uneven distribution contributes to the median pay gap observed.
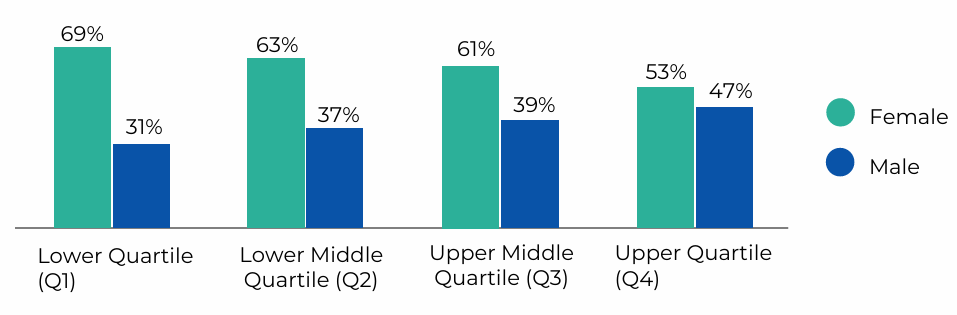
| Quartile | Female | Male |
|---|---|---|
| Lower (Q1) | 69% | 31% |
| Lower Middle (Q2) | 63% | 37% |
| Upper Middle (Q3) | 61% | 39% |
| Upper (Q4) | 53% | 47% |
Bonus gender pay gap
In 2021, as part of the university’s desire to reward staff for the extra work carried out during the pandemic, 90% of staff received bonus payments, with 81% receiving bonuses of £500.

The proportion of employees receiving a bonus is 89.6% for males and 90% for females.
| Year | Median | Mean |
|---|---|---|
| 2021 | 0% | 1.7% |
| 2020 | 0% | 27.0% |
Understanding the changes to our gender pay gap
Vertical Segregation: The distribution of men and women across pay quartiles is a significant reason for our pay gap. Across the grades there were more men than women in the higher graded and senior roles.
Additional hours worked by our Associate Lecturers (ALs): Over the 12-month period, we asked our ALs to work more hours to support extraordinary student growth during the Covid-19 pandemic (up nearly 30%). This means that some ALs were working additional hours outside their contracted framework.
Due to the gender pay gap methodology, the calculation of earnings must reflect an hourly wage and this requirement has artificially inflated the average hours worked for ALs. The end result gives the impression that male AL colleagues were paid more for the same work, when in fact, male ALs were working more additional hours than their female counterparts.
Our Ethnicity Pay Gap
What is the ethnicity pay gap?
The ethnicity pay gap is calculated using the same calculation methodology as for gender pay gap reporting and is expressed as a percentage of average non minority earnings.
This is the first year we have published the ethnicity pay gap, in line with our new EDI strategy and to show greater transparency, demonstrate accountability and identify inequalities that need to be addressed.
This report uses ‘BAME’ as a label for minority ethnic groups. This is how our data is grouped and remains a commonly-used data label, but we recognise the limitations of that term and its artificial creation of homogeneity.
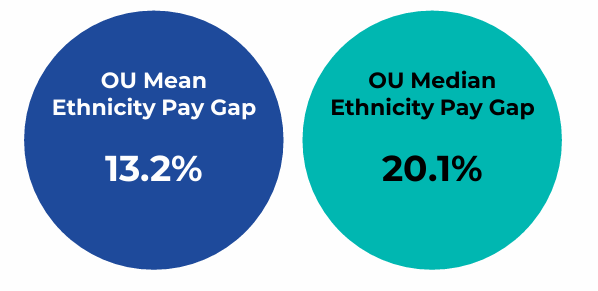
The ethnicity pay gap is 13.2% (mean) and 20.1% (median).
Pay Quartiles – ethnicity pay gap
Ultimately, there is uneven distribution in the upper pay quartiles and senior roles. There is greater representation of white colleagues (93%) in the upper pay quartiles compared to minority ethnic colleagues (7%)
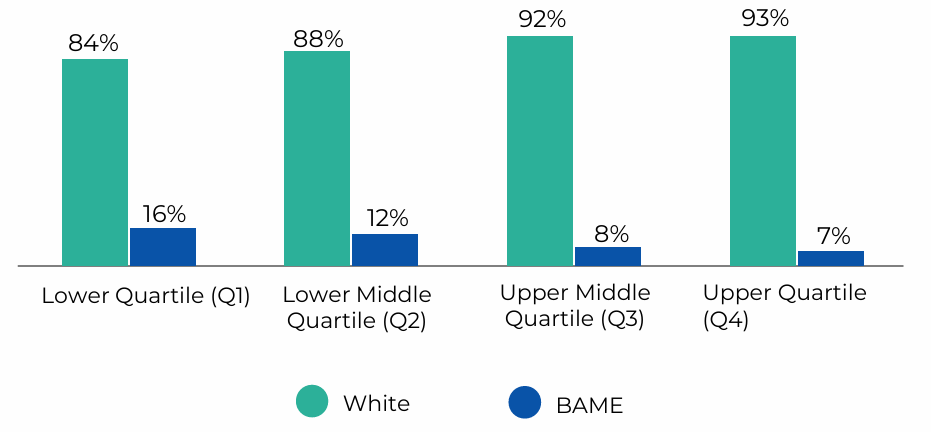
Across all pay quartiles, white people represent the majority.
| Quartile | BAME | White |
|---|---|---|
| Lower (Q1) | 16% | 84% |
| Lower Middle (Q2) | 12% | 88% |
| Upper Middle (Q3) | 8% | 92% |
| Upper (Q4) | 7% | 93% |
What is the OU doing to address its pay gaps?
Publishing the ethnicity pay gap and being transparent about all our gender and ethnicity data is the first step to addressing the issues identified in this report. These issues are, however, systemic, and we need to ensure long-term commitment and meaningful actions which are driven by our data.
Our data shows that there is an issue with women and people who are categorised as BAME represented at senior levels. We have higher proportions of males and white staff in higher pay quartiles. To diversify the candidate pool on which we are drawing and to provide support for staff to progress, we have identified the following actions.
Charters and external initiatives
- The University is one of the pilot institutions for 100 Black Women Professors NOW, an initiative run by the Women's Higher Education Network (WHEN). We, like many UK Higher Education Institutions (HEIs), have few Black women at professorial level and will work with the WHEN scheme to diversify our academic leaders.
- The University will prioritise actions on recruitment and progression from the Athena Swan institutional action plan. Other HEIs have shown that job sharing is a viable model for increasing the number of women in senior posts, and we will revise and enhance our policy around this. Another Athena Swan action centres on anonymous focus groups tracking gendered perceptions of fairness in recruitment and selection. We will ensure these are priority actions and will aim to include intersectional analysis within the reporting.
- Alongside our engagement with Athena Swan, supporting the institutional action plan and helping Schools apply for an award, the OU will also engage with the Race Equality Charter, aiming to submit for a bronze award in the next eighteen months. This robust self-assessment process will help us to identify important interventions.
Pay
- The OU is introducing pay consistency panels to review pay proposals across all staff groups, in order to minimise pay bias.
- Units within the University will be provided with pay gap data broken down for their business area allowing greater scrutiny of and accountability for their gender and ethnicity pay gaps.
Recruitment
- In 2022, a full review of how the University undertakes recruitment and selection will be conducted. We will continue to pilot anonymous recruitment, and also introduce further initiatives to diversify the talent pool, including looking at how and where we advertise our jobs.
- Explanatory positive action guidance will be rolled out to all hiring managers. Using data from the Unit’s People Business Plan, managers will be able to identify where gaps exist in teams and business areas. Managers will be provided with support and guidance to effectively implement positive action and to understand the difference between this and positive discrimination.
We are responding to our pay gap data as a priority and we are committed to building a fair and equitable institution where everyone can progress and work at their full potential. The above actions are not quick fixes but aim to drive positive and long term changes that will help us close both our gender and ethnicity pay gaps. We will work collaboratively with colleagues across the Open University to accelerate the change we want to see and ensure that everyone feels valued in our institution.
Statement
"At the Open University we are committed to addressing both our ethnicity and gender pay gaps through data-driven, meaningful actions. We will continue to monitor and address these gaps as part of our Equality, Diversity and Inclusion agenda."
Professor Tim Blackman Vice-Chancellor
Professor Marcia Wilson Dean of Equality, Diversity and Inclusion
Contact us
Equality, Diversity and Inclusion
The Open University
Walton Hall
Milton Keynes
MK7 6AA
Email [email protected]


Explore

Undergraduate
Postgraduate
Policy
-
Follow us on Social media
-


